Partition
Repeats its children once per group of rows, all in the same frame: one line, fit or density per group.
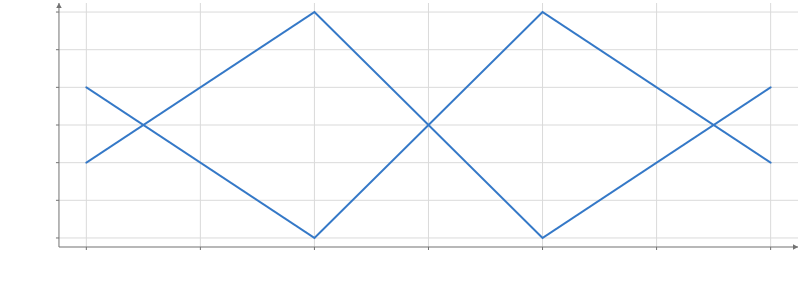
Static preview; loading the interactive plot
import hmplot as hm

data = {
    "x": [1, 2, 3, 4, 1, 2, 3, 4],
    "y": [3, 1, 4, 2, 2, 4, 1, 3],
    "group": ["a", "a", "a", "a", "b", "b", "b", "b"],
}
with hm.Plot(data=data, height=300, axes2d=True) as plot:
    with hm.Partition(by="group"):
        hm.Line(x="x", y="y")
plot
Usage
Partition mounts its children once per distinct value of by — a column name, or a list of names for the combinations — with each copy bound to that group’s rows. Every group draws in the same frame, with the parent’s scales, axes, camera, legend, and renderer: there is no layout and no cell. One key makes one group per value that has rows, so a value that disappears from the table (or is filtered out upstream) takes its group with it; a list of keys keeps every combination of those values. Groups follow the key column’s order: first appearance for a plain array, dictionary order for a categorical column (every string column from Python), ascending for a numeric one. Rows whose key is missing are not dropped: they form a trailing group labelled (missing) whose value is null.
Because every group contributes to the inherited domains, the frame looks exactly as it would if the children had been mounted once over the whole table. Transforms inside a Partition run once per group, which is what makes a per-group Density, fit, or summary a two-line change.
Use Facet instead when each group should get its own plot; a Facet cannot be nested inside a Partition (partition inside the facet instead). A Frame inside a Partition is allowed and gives each group an inset.
bind:this gives a PartitionHandle: getGroups() lists the mounted groups, each a PartitionGroup with its key (JSON of the key values), values by column, display label and its marks’ legend sources; whenSettled() waits for every group; endpoint(name, {at}) selects the mark named name in every group for connect(). Python’s await partition.groups() returns the keys, values, labels and mark labels.
Legends show one entry per authored mark, however many groups there are. legendGroups gives each group its own entry, labelled by the key values, for marks whose appearance does not otherwise vary by group; clicking one entry hides only that group.