Sort
Orders the rows by one or more columns, so a line connects them in that order.
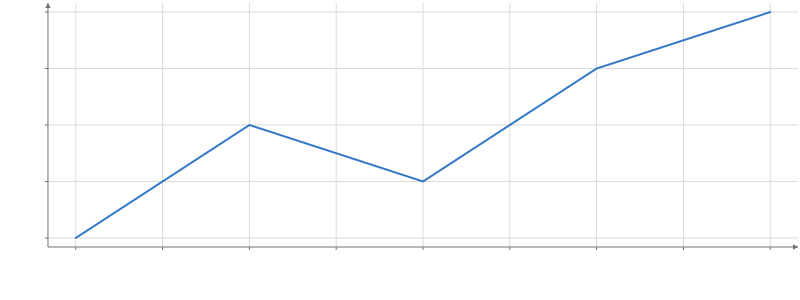
Static preview; loading the interactive plot
import hmplot as hm

data = {"x": [3, 1, 4, 2, 5], "y": [2, 1, 4, 3, 5]}
with hm.Plot(data=data, height=300, axes2d=True) as plot:
    with hm.Sort(by="x"):
        hm.Line(x="x", y="y")
plot
Usage
Retains all columns and original picking identities. by accepts one field or an ordered list. Default order is asc and missing values sort last. Lines follow the resulting order; no mark sorts its input implicitly.
To let the viewer change a setting, read an input in it: order={input("order")} (Python order=hm.input.order), where order is a Select of "asc" and "desc".