Interpolate
Fills a regular grid from scattered samples, for a heatmap, contours or a smooth line.
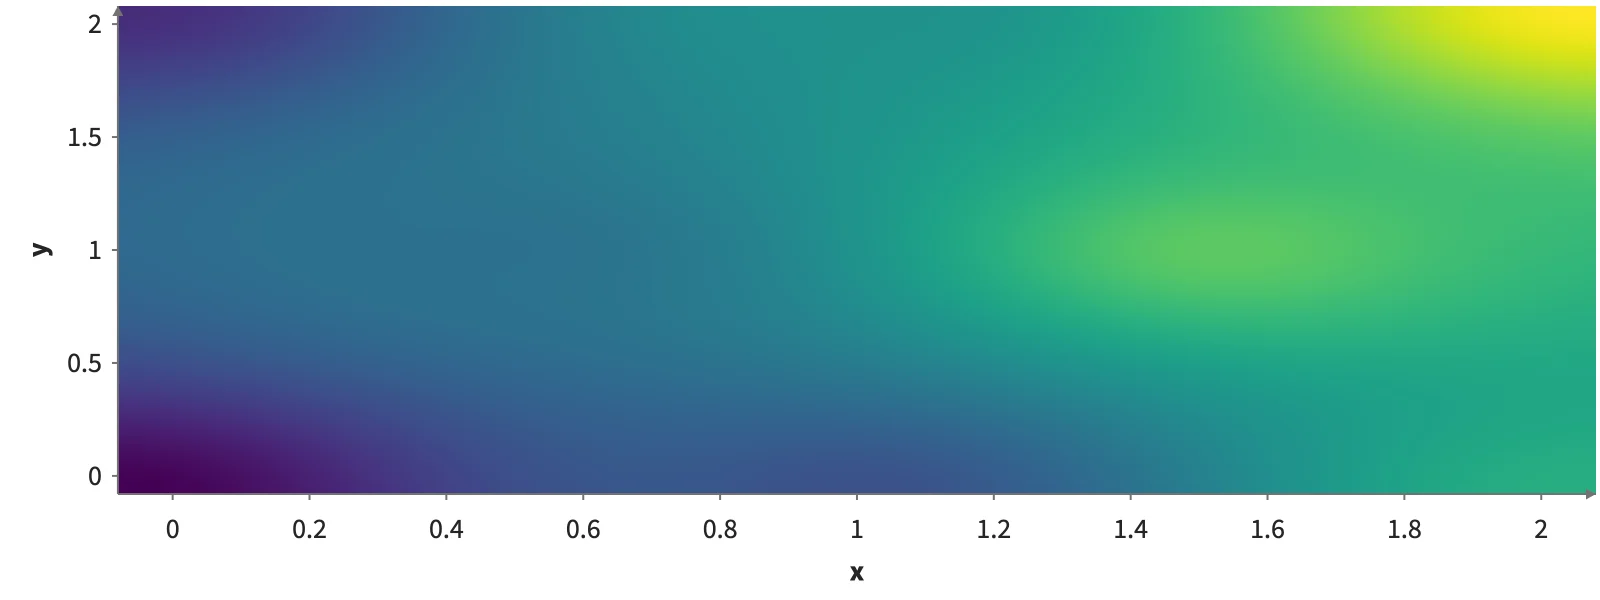
Static preview; loading the interactive plot
import hmplot as hm

data = {
    "x": [0, 1, 2, 0, 1, 2, 0.5, 1.5],
    "y": [0, 0, 0, 2, 2, 2, 1, 1],
    "temperature": [10, 12, 15, 11, 14, 18, 13, 16],
}
with hm.Plot(data=data, height=300, axes2d=True) as plot:
    with hm.Interpolate(x="x", y="y", values=["temperature"]):
        hm.Heatmap(fill="temperature")
plot
Usage
Outputs coordinates and requested value columns as a grid table (y then x; see Data, “Grid tables”), its 2-D cells tiling the bounds. auto uses linear interpolation in 1D, bilinear for complete rectangular data, and local IDW for scattered 2D samples. Categories always use nearest neighbors. Numeric columns share interpolation geometry.
To let the viewer change a setting, read an input in it: resolution={input("resolution")} (Python resolution=hm.input.resolution), where resolution is a Slider.