Column
Stacks its children top to bottom.
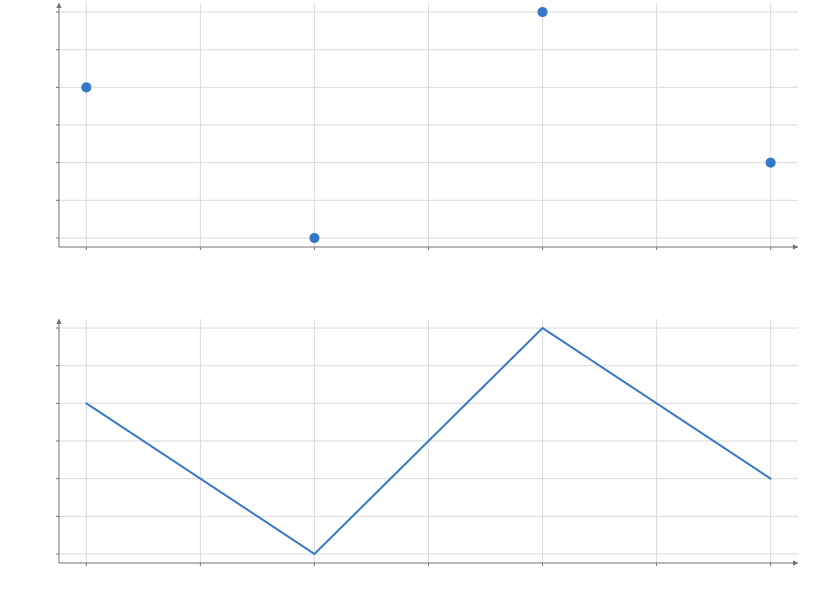
Static preview; loading the interactive plot
import hmplot as hm

data = {"x": [1, 2, 3, 4], "y": [3, 1, 4, 2]}
with hm.Column() as column:
    with hm.Plot(data=data, height=300, axes2d=True):
        hm.Points(x="x", y="y")
    with hm.Plot(data=data, height=300, axes2d=True):
        hm.Line(x="x", y="y")
column
Usage
A Python layout container with gap in pixels. Data/transform scopes do not add visible layout boxes. In Svelte use ordinary document layout.