Text3D
One piece of text drawn as geometry in the plot, plain or TeX math.
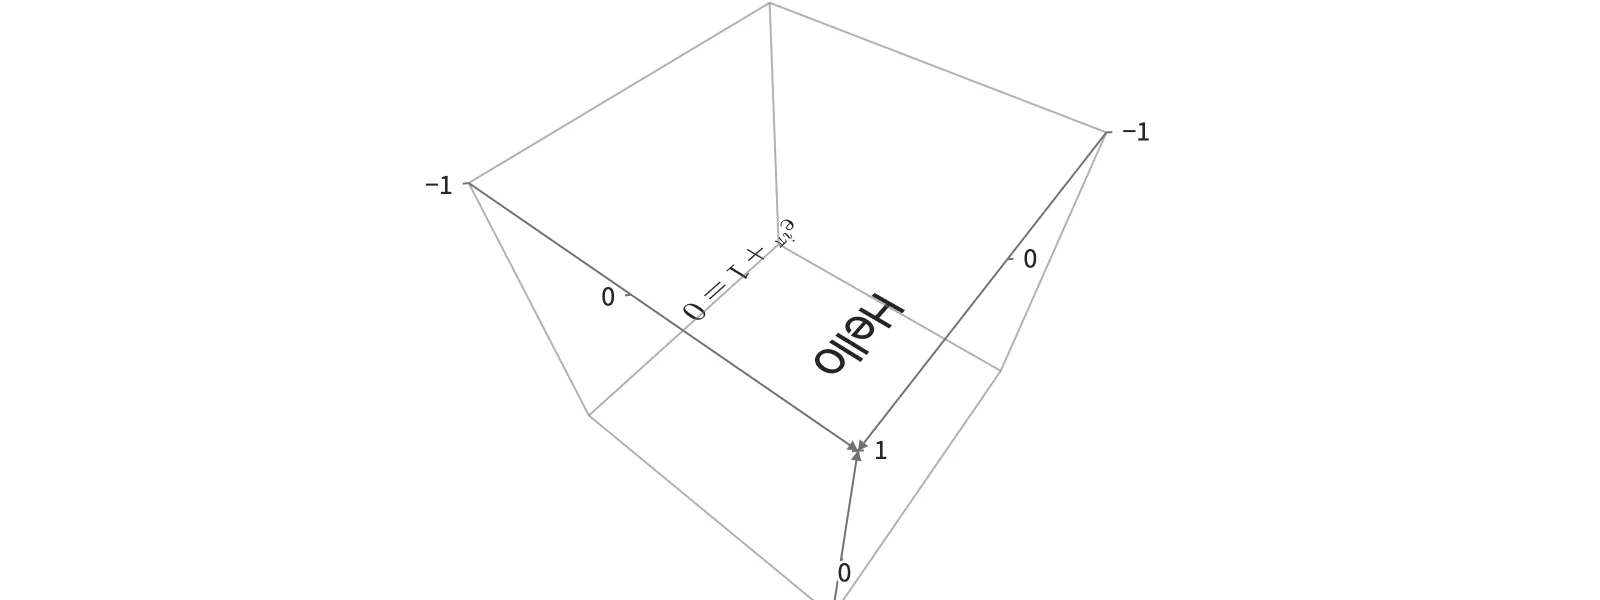 Static preview
; loading the interactive plot
import hmplot as hm

with hm.Plot(type="3d", height=300, axes3d=True) as plot:
    hm.Text3D(text="Hello", position=[0, 0.4, 0], size=10)
    hm.Text3D(text=r"e^{i\pi} + 1 = 0", tex=True, position=[0, -0.4, 0], size=10)
plot
Options
Keywords are snake_case.
Options
textstring- The text to draw. Text3D draws one label; use Text for a label per row.
texboolean- Typeset the text as TeX math (with MathJax), such as \frac{1}{x^2+1}. Default:
False. datatable- A table for this mark alone: a mark with data displays on its own, in a Plot of its own.
Position
position[number, number] | [number, number, number]- Where the text sits, [x, y] or [x, y, z]: its middle, or the end that align names. Default:
[0, 0, 0].
Appearance
colorchannel- The text's color, a CSS color. Default: the theme's Text color (#252525 in the default theme).
sizechannel- The text's size (its font size): one number. Default:
3world units. opacitychannel- The opacity, 0 to 1: a number, or a column (categories map through opacity_scale). Default:
1.
Scales
size_scalescale- The size's scale, which marks can share: continuous({domain, range, transform}) for numbers (without a range, the automatic one), or categories with a numeric range.
Display
labelstring- The mark's name in the legend and the settings pane.
legendboolean- Whether the mark has a legend entry. Default:
True. visibleboolean- Whether the mark is drawn. Default:
True. domainsboolean- Whether the mark's data counts toward its axes' automatic domains; false leaves them to the other marks (a reference line, a decorative part). Default:
True. rows"auto"- "auto" draws one item when no channel reads a column (a line at a value, a label at a point), instead of one per row of the data; "@" view-state fields are not columns.
blend"normal" | "additive" | "multiply" | "screen" | "subtractive"- How the mark mixes with what is drawn under it; any mode but normal draws it transparent, and SVG and PDF exports draw additive and subtractive as an image. Default:
"normal". glownumber- How much the mark glows: its own color times glow blooms around it in the plot's presentation (0 does not glow); the Plot's bloom effect sets the bloom's strength and radius. SVG and PDF exports draw the whole plot as an image. Default:
0. optionsstring[]- The settings the settings pane shows for this mark, by name.
namestring- The mark's name in the settings pane, and the name facet.endpoint() and partition.endpoint() find it by.
Animation
animationboolean- Animate changes to the mark's values. Default:
False. animation_durationnumber- How long an animated change takes. Default:
300ms. animation_easing"linear" | "quad-in" | "quad-out" | "quad-in-out" | "cubic-in" | "cubic-out" | "cubic-in-out" | "sine-in-out"- The animation's easing. Default:
"cubic-in-out".
The mark's own axes
x_transform"linear" | "log" | "sqrt" | "symlog"setting- This mark's own x transform, instead of its frame's. Default: its frame's.
x_invertbooleansetting- Reverse this mark's x direction. Default:
False. xbounds[number, number]setting- The x extent this mark maps, instead of its frame's domain (an image's or a grid's extent). Default: its frame's.
xrange[number, number]setting- Where this mark's x extent lands, in its frame's world units. Default: its frame's.
y_transform"linear" | "log" | "sqrt" | "symlog"setting- This mark's own y transform, instead of its frame's. Default: its frame's.
y_invertbooleansetting- Reverse this mark's y direction. Default:
False. ybounds[number, number]setting- The y extent this mark maps, instead of its frame's domain (an image's or a grid's extent). Default: its frame's.
yrange[number, number]setting- Where this mark's y extent lands, in its frame's world units. Default: its frame's.
z_transform"linear" | "log" | "sqrt" | "symlog"setting- This mark's own z transform, instead of its frame's. Default: its frame's.
z_invertbooleansetting- Reverse this mark's z direction. Default:
False. zbounds[number, number]setting- The z extent this mark maps, instead of its frame's domain (an image's or a grid's extent). Default: its frame's.
zrange[number, number]setting- Where this mark's z extent lands, in its frame's world units. Default: its frame's.
Text settings
fontstringsetting- The typeface of the 3D text. Default:
"helvetiker". align"left" | "center" | "right"setting- How each text sits at its position. Default:
"center". billboardbooleansetting- Turn the text to face the camera. Default:
False.
Usage
For text as geometry in data units (in the plot plane unless billboard; tex draws TeX). Use Text for a data-driven text channel or many screen-sized labels. Text3D keeps its existing sizing and geometry semantics. Without a color, it takes the theme’s Text color.