Point labels
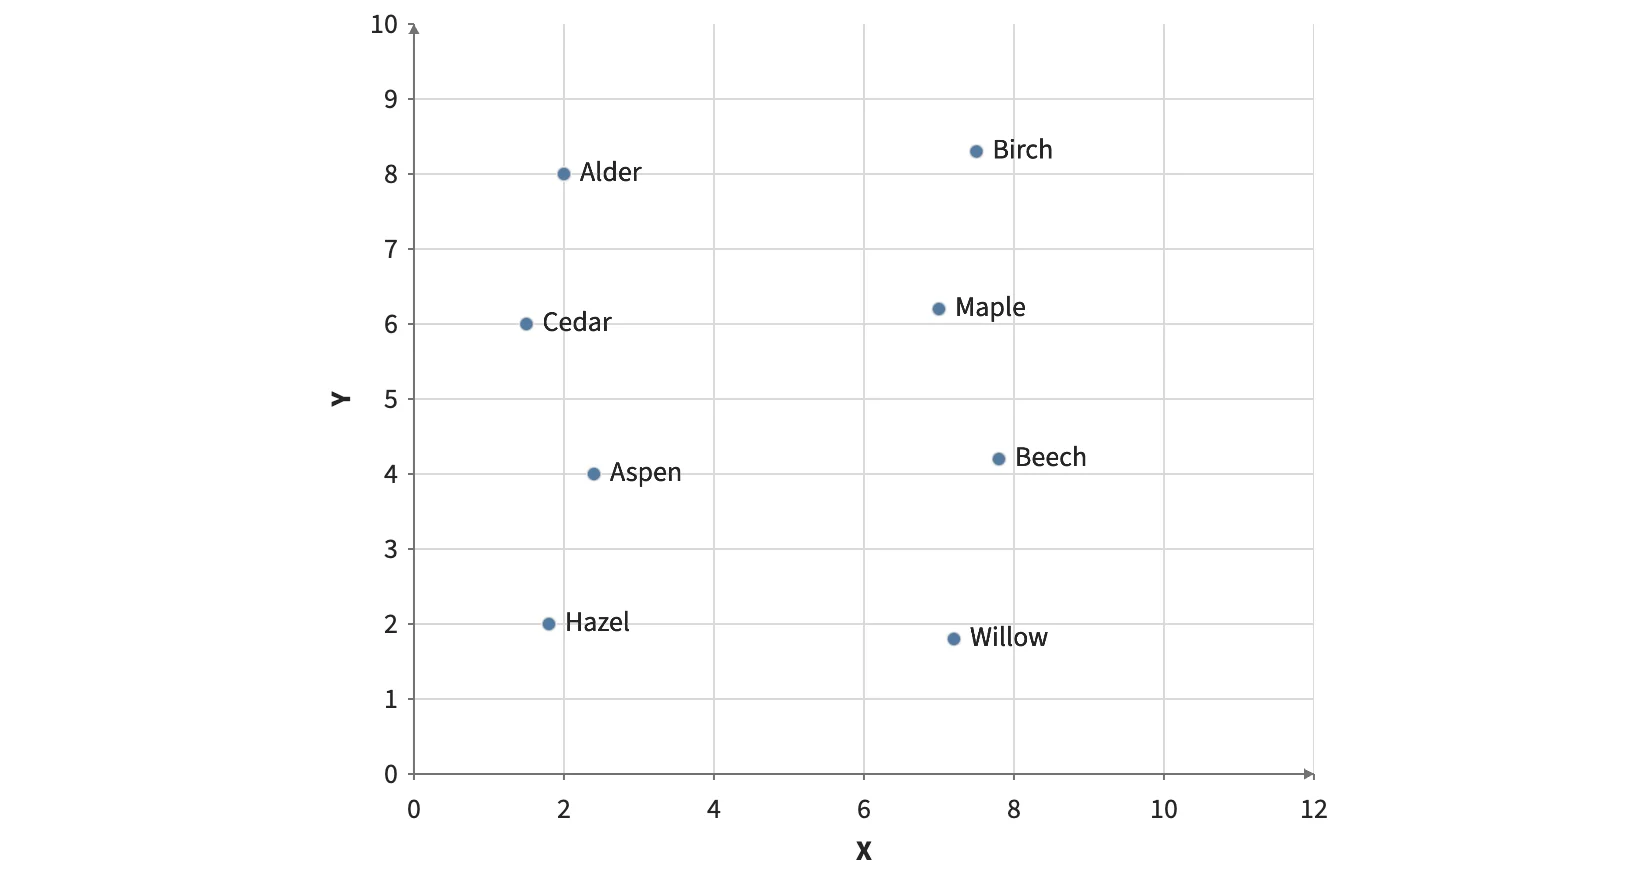
Named observations with GPU-rendered labels that follow pan and zoom.
Static preview; loading the interactive plot
<Plot data={observations}>
  <Points x="x" y="y" />
  <Text x="x" y="y" text="name" dx={8} align="left" />
</Plot>Named observations with GPU-rendered labels that follow pan and zoom.
Static preview; loading the interactive plot
<Plot data={observations}>
<Points x="x" y="y" />
<Text x="x" y="y" text="name" dx={8} align="left" />
</Plot>