Select
One or several options, chosen by the viewer and read by name; a Select of column names picks what a channel plots.
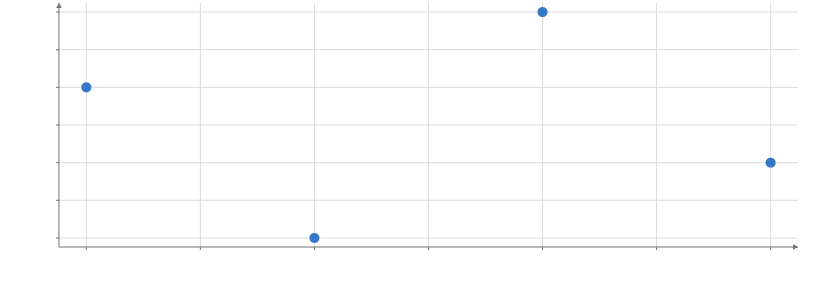
Static preview; loading the interactive plot
import hmplot as hm

data = {"a": [1, 2, 3, 4], "b": [4, 2, 3, 1], "y": [3, 1, 4, 2]}
# "$column" reads the input where a string names a column: x plots the chosen one.
with hm.Scene() as scene:
    hm.Select(name="column", options=["a", "b"])
    with hm.Plot(data=data, height=300, axes2d=True):
        hm.Points(x="$column", y="y")
scene
Usage
Set multiple={true} in Svelte or multiple=True in Python to choose several options. The
value is then a list (empty by default), and is_in(col("species"), input("chosen")) uses it
to filter rows. When data-derived options change, choices that are no longer present are
removed. This replaces MultiSelect.
An input sends its value up to the nearest input context (an InputContext, a Python Scene, or a Template instance), and everything in that context reads it by name: input("name") in JavaScript, hm.input.name in Python, or the string "$name" where a string names a column. A read is replaced by the value before its reader sees it, so moving an input re-runs its readers once, and the change animates like any other data change. Inputs go beside Plots (in a Row or Column), not inside them.