charts.Crosshair
Rules that follow the pointer across the frame, with a readout of its x and y.
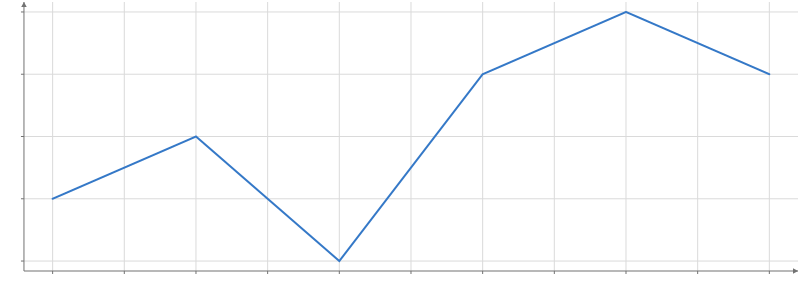
Static preview; loading the interactive plot
import hmplot as hm

data = {"x": [1, 2, 3, 4, 5, 6], "y": [3, 4, 2, 5, 6, 5]}
with hm.Plot(data=data, height=300, axes2d=True) as plot:
    hm.Line(x="x", y="y")
    hm.charts.Crosshair()
plot
Usage
Place a Crosshair in a Plot (or in a Frame) and it follows the pointer there: a rule each way and a readout of each value. Readouts are finer than the ticks: a time with its time of day, a number to about a thousandth of the visible span, angles and map coordinates in degrees. By default they sit just inside the frame’s bottom and left edges; readoutPosition="pointer" puts one label beside the pointer that holds both, for a polar frame or a map, whose rules have no edge to pin to.
Nothing draws while the pointer is off the frame. A still pointer costs nothing: the rules and readouts update once per animation frame with a move. axes="x" keeps only the vertical rule; readout={false} drops the text.
Crosshair is a built-in template, built from transforms and simpler marks: import it from hmplot/charts.