Crosshair and rules
Move the pointer over a time series: the crosshair follows it with a readout of each value. A dashed rule marks a threshold and gray rules mark events from a second table, labeled at the top of the frame.
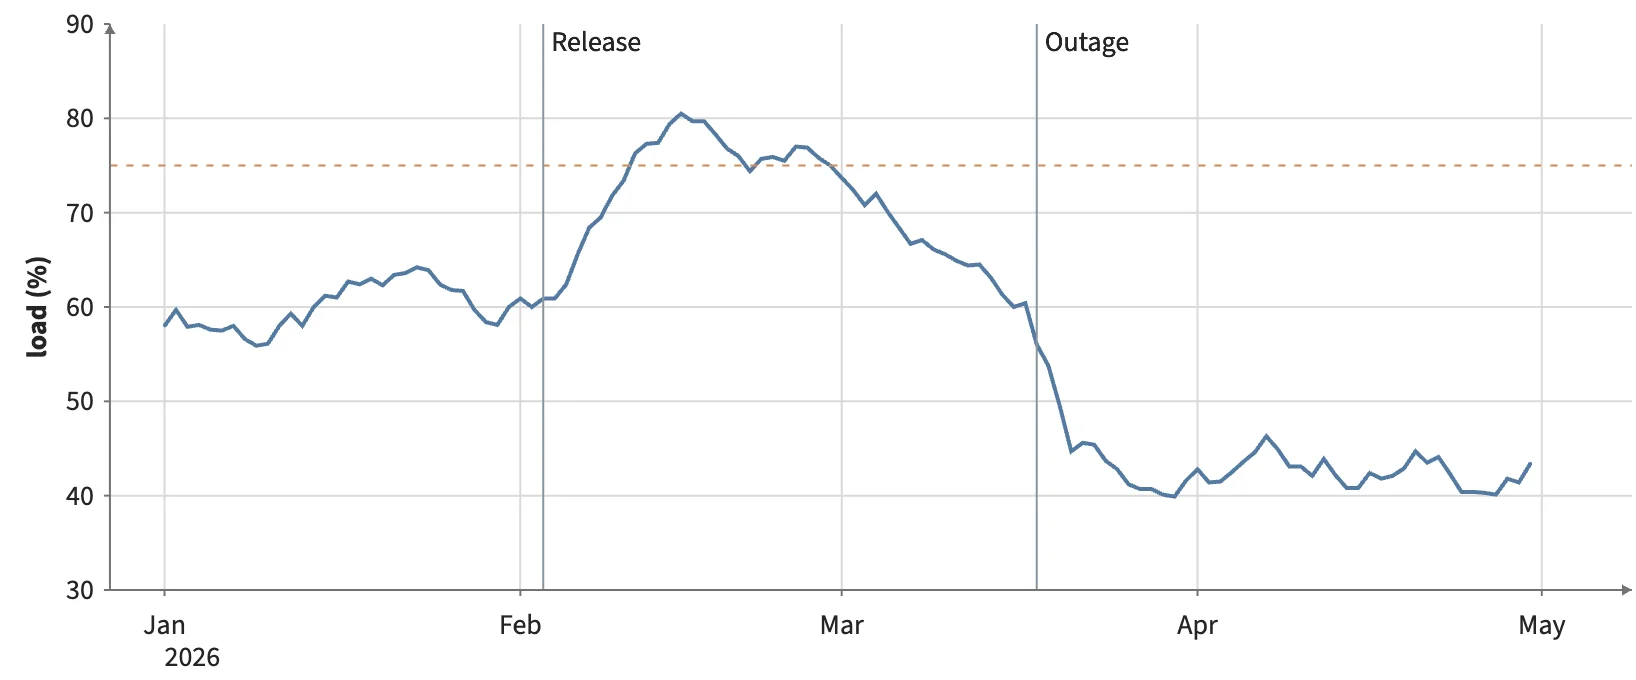
Static preview; loading the interactive plot
<script>
  import { Data, Plot, Line, Text } from "hmplot";
import { RuleX, RuleY, Crosshair } from "hmplot/charts";
  const day = 86400000, start = Date.UTC(2026, 0, 1);
  const series = { date: [], load: [] };
  for (let i = 0, level = 60; i < 120; i++) {
    level += Math.sin(i * 0.9) * 1.5 + Math.cos(i * 0.23);
    series.date.push(new Date(start + i * day));
    series.load.push(level);
  }
  const events = { date: [new Date(start + 33 * day), new Date(start + 76 * day)], name: ["Release", "Outage"] };
</script>
<Plot data={series} responsive height={340} axes2d y={{ label: "load (%)" }}>
  <Line x="date" y="load" color="#547ba2" width={2} />
  <RuleY y={75} color="#cf8955" dash />
  <Data value={events}>
    <RuleX x="date" color="#8a949e" />
    <Text x="date" y="@view_y_max" text="name" dx={4} dy={10} align="left" legend={false} />
  </Data>
  <Crosshair />
</Plot>