Shift
Shift a numeric or datetime coordinate by a numeric or UTC calendar interval.
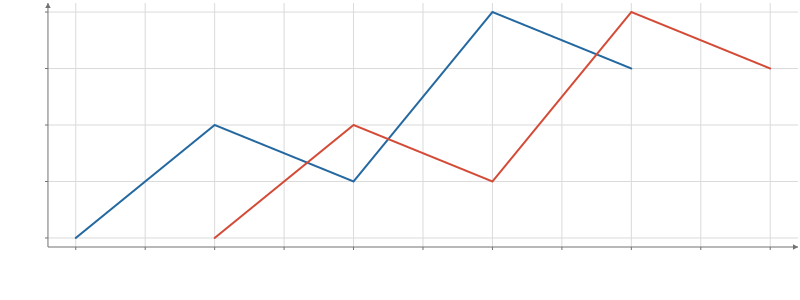
Static preview; loading the interactive plot
import hmplot as hm

data = {"day": [0, 1, 2, 3, 4], "value": [2, 4, 3, 6, 5]}
with hm.Plot(data=data, height=300, x={"label": "Day"}, y={"label": "Value"}) as plot:
    with hm.Shift(field="day", interval=1):
        hm.Line(x="original", y="value", color="#2468a0", name="original")
        hm.Line(x="shifted", y="value", color="#d34b37", name="shifted")
plot
Usage
Shift offsets coordinates, preserving observations and their order. It adds shifted and original columns to its children; as renames either. Use the outputs on x, y, or another
numeric channel. A positive interval moves coordinates forward; a negative one moves them back.
It does not lag rows or look up a previous observation.
Numeric intervals use data units, including milliseconds for datetimes. Named intervals require a datetime column and use UTC: millisecond, second, minute, hour, day, week, month, quarter, half, year, or a weekday (one week), optionally plural and prefixed with a signed integer. Month/year offsets follow UTC calendar rollover, retaining time of day; January 31 plus one month can fall in March. Missing values remain missing.
Inspired by Observable Plot’s shiftX/shiftY, this column-based transform works on either axis. HMPlot keeps its usual scale inference: it does not silently crop the domain to the overlapping period. Set a Plot/Frame domain or use Filter when an overlap is desired. Numeric and fixed-duration shifts run on the device. Variable calendar offsets retain exact host values when available; derived device columns need one readback. Datetime metadata and origin are preserved. No grouping or sorting is needed for a coordinate offset.
Transform handles support update(), whenSettled() and status subscriptions. Intervals
can read an HMPlot input; portable templates serialize the transform as ordinary scene data.