HMPlot

Minimap

A small overview of a plot's whole extent, with a rectangle to drag its view around (a 3D plot gets an orientation gadget).
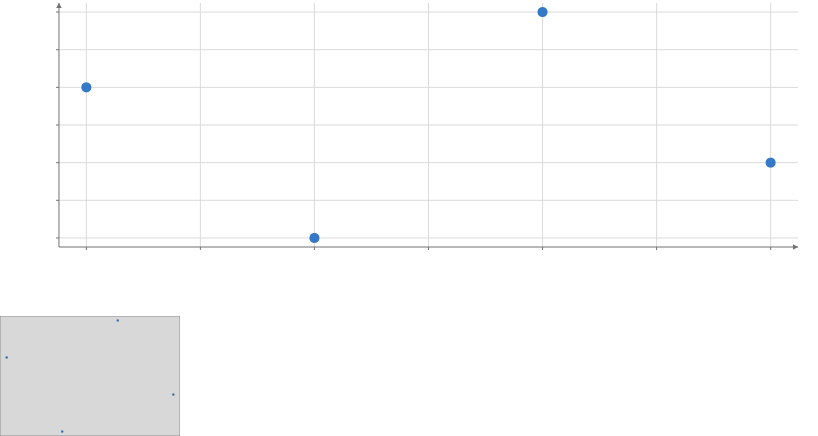
Scatter plot of y against x. x from 0.9 to 4.1, y from 0.9 to 4.1. 4 points.

Static preview; loading the interactive plot

import hmplot as hm

data = {"x": [1, 2, 3, 4], "y": [3, 1, 4, 2]}
with hm.Scene() as scene:
    with hm.Plot(data=data, height=300, axes2d=True) as plot:
        hm.Points(x="x", y="y")
    hm.Minimap(target=plot)
scene

Options

Keywords are snake_case.

Options

axisFrameHandle
The Frame whose axis settings (bounds, transform, format) the minimap's axis labels follow. Default: the plot's root frame.
axesboolean | {x, y}
Whether the minimap labels its axes: true for both, or {x, y} for each. Default: False.
display_scalenumber
A multiplier on the marks' sizes in the overview, relative to their sizes in the plot. Default: 0.35.
targetPlotHandle
The Plot the minimap shows and moves (Python target=).
widthnumber
The minimap's width. Default: 180 px.
heightnumber
The minimap's height. Default: 120 px.

Advanced renderer options

max_instancesnumber | null
The most rows of each mark the overview draws; past it the rows are sampled (null draws them all). Default: 1000.

Usage

for selects the source (target in Python). axes defaults to false. Source updates repaint overview content; camera-only navigation updates the viewport rectangle. 3D views use the orientation gadget. The minimap takes its plot’s background and text color, and leaves text out (labels, TeX and a map’s place names). A live VectorTile’s minimap shows the whole world, from its zoom-0 tile.

Related examples

Long time series