Contour
Contour lines or filled bands of a grid, such as a 2-D density.
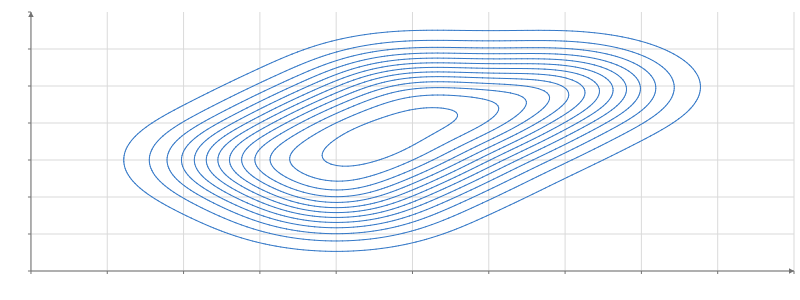
Static preview; loading the interactive plot
import hmplot as hm

data = {"x": [1, 2, 2, 3, 3, 4, 5], "y": [2, 1, 3, 2, 4, 3, 4]}
with hm.Plot(data=data, height=300, axes2d=True) as plot:
    with hm.Density(x="x", y="y"):
        with hm.Contour(field="density"):
            hm.Segments(start="start", end="end")
plot
Usage
Contour draws iso-lines (mode="lines": start, end and level per segment, for Segments) or filled bands (mode="bands": triangles with lower, upper and band, for Polygon) of a grid table’s field, on the GPU. thresholds is a count of nice levels over the field’s range (default 10) or the levels themselves.
Lines match d3-contour’s marching squares. Bands clip four triangles per cell against each band, so a saddle is resolved by the cell’s mean. Missing values and hidden cells draw nothing.