Density contours
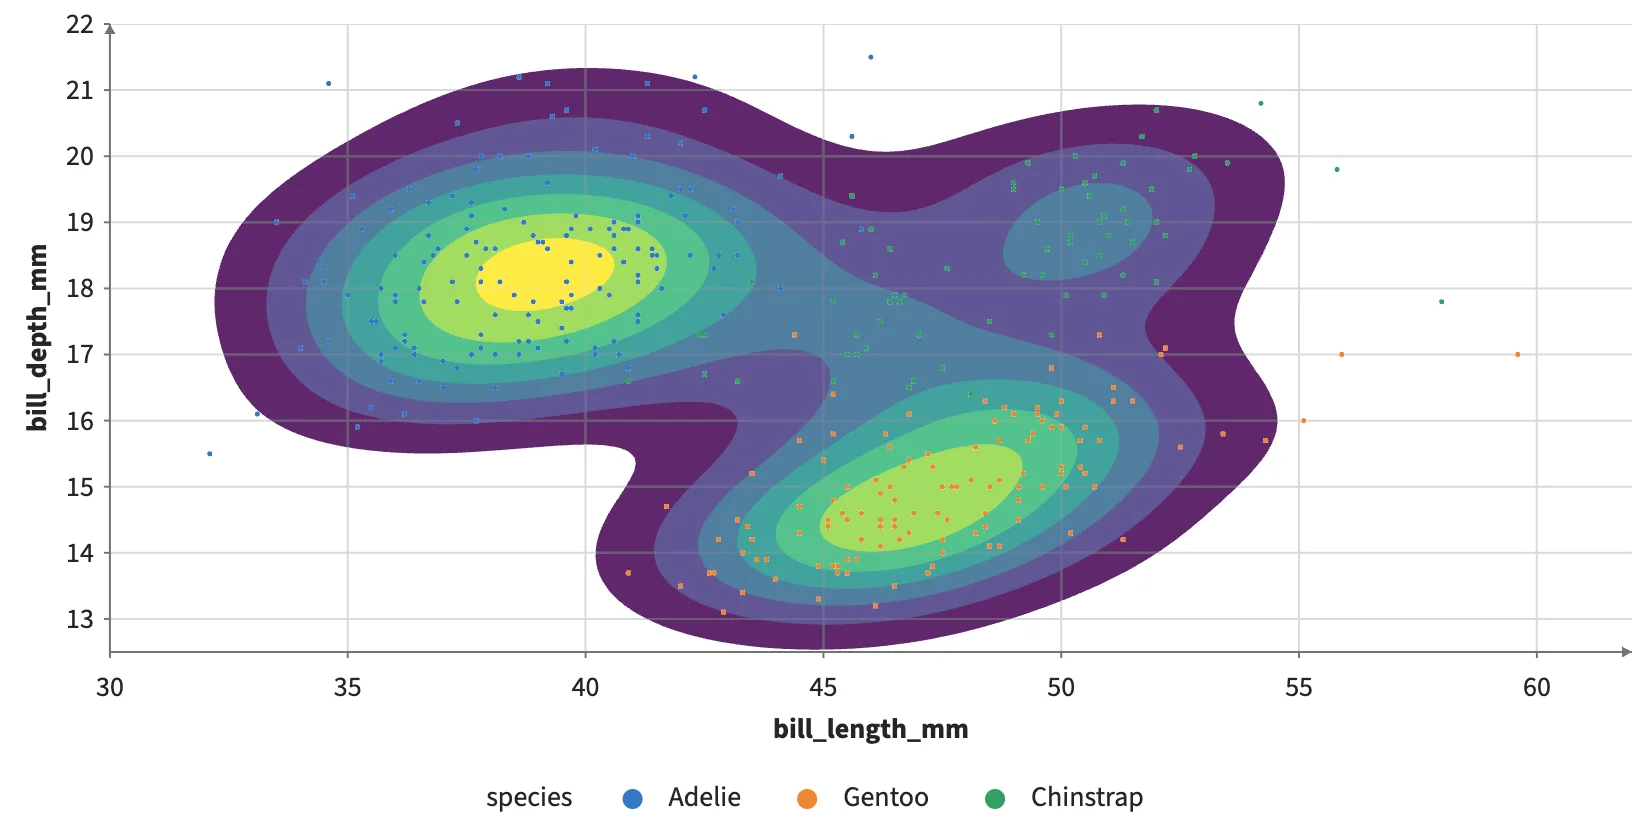
The density of penguins' bill length against depth as filled bands, contour lines or both, on the GPU: Density, then Contour's marching squares.
Static preview; loading the interactive plot
<InputContext>
  <Checkbox name="bands" value={true} label="Bands" />
  <Checkbox name="lines" value={false} label="Lines" />
  <Provider url="/data/penguins/penguins.csv" format="csv">
    <Plot axes2d>
      <DensityBands x="bill_length_mm" y="bill_depth_mm" thresholds={10} visible={input("bands")} />
      <DensityContour x="bill_length_mm" y="bill_depth_mm" thresholds={10} visible={input("lines")} />
      <Points x="bill_length_mm" y="bill_depth_mm" fill="species" />
    </Plot>
  </Provider>
</InputContext>