HMPlot

stats.Hexbin

Counts the points in each hexagon of a hexagonal grid over x and y.
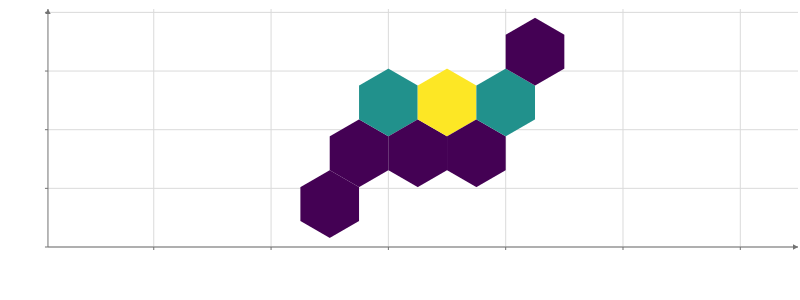
Bars of y against x, colored by count. x from 0 to 5, y from 1 to 5. 8 bars.

Static preview; loading the interactive plot

import hmplot as hm

data = {
    "x": [1, 1.4, 2, 2.2, 2.5, 2.7, 3, 3.1, 3.5, 4, 4.2, 5],
    "y": [2, 2.6, 3, 2.8, 3.2, 3.1, 3, 3.5, 2.9, 4, 3.8, 4.5],
}
with hm.Plot(data=data, height=300, axes2d=True, aspect="equal") as plot:
    with hm.stats.Hexbin(x="x", y="y", bins=4):
        hm.Prism(x="x", y="y", width="width", depth="depth", rotation="rotation", shape="hexagon",
                 z0=0, z1=0, fill="count")
plot

Options

Keywords are snake_case.

namestring
Names the transform, so a Facet's getTransform(name) reaches its copy in every cell.
xchannel
The x values to bin; each hexagon's row gets x, its center's x.
ychannel
The y values to bin; each hexagon's row gets y, its center's y.
binsnumber | expression
How many hexagons span the x extent (or the x of `bounds`). Default: 30.
radiusnumber | expression
The hexagons' radius, instead of the one bins gives. Each row's width and depth columns give a Prism with shape="hexagon" this size. Default: from bins. In data units.
bounds{x, y}
A fixed grid: the hexagons covering these x and y ranges, one row per hexagon with the occupied ones shown, so filtering the input never changes the output's length. Points outside fall in no hexagon. In data units.
orientation"pointy" | "flat"
Whether the hexagons point up or have flat tops; each row's rotation column (30 or 0 degrees) turns a Prism's hexagon to match. Default: "pointy".
shared_binsboolean
In a Facet, gives every cell the same hexagon grid; false sizes each cell's grid from its own rows. Default: True.
columns{[name]: expression}
Columns to compute over each hexagon's rows besides count, each a reduction expression as in Calculate: {mean_v: mean("v")}, Python {"mean_v": hm.mean("v")}. With bounds, a count, sum or mean of a column keeps the fixed grid; any other column groups the hexagons.
as_{[column]: string}
New names for the output columns, such as {count: "n"}.

Usage

Outputs occupied-cell centers, width, depth, rotation, count, and columns: reduction expressions as in Group (columns={{ mean_v: mean("v") }}). Defaults to 30 cells across X and pointy orientation. radius chooses an explicit cell radius. Facets share the lattice unless sharedBins is false.

The cells are regular hexagons in data units: a Plot that fills its box scales x and y independently and stretches them. Give the Plot aspect="equal" (as the example does) when the cells should look regular, with one data unit as long on x as on y.

To let the viewer change a setting, read an input in it: bins={input("bins")} (Python bins=hm.input.bins), where bins is a Slider.

Related examples

Facets & transforms