HMPlot

Slider

A number, date or two-endpoint interval the viewer drags between min and max, read by name.
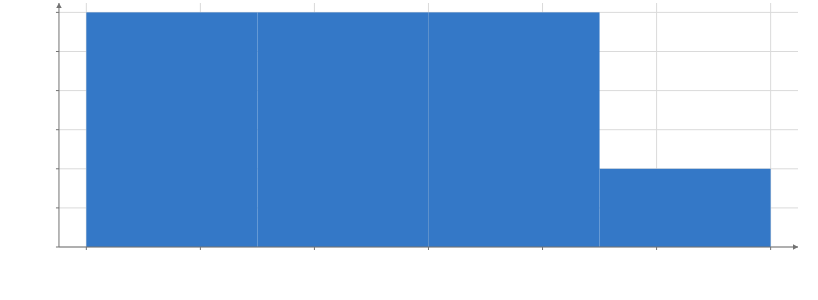
Rectangles of count against x. x from 1 to 7, y from 0 to 3.1. 4 rectangles.

Static preview; loading the interactive plot

import hmplot as hm

data = {"x": [1, 2, 2, 3, 3, 3, 4, 4, 5, 7]}
with hm.Scene() as scene:
    hm.Slider(name="bins", min=1, max=10, step=1, value=4)
    with hm.Plot(data=data, height=300, axes2d=True):
        with hm.stats.Bin(x="x", bins=hm.input.bins):
            hm.Rect(x0="x0", x1="x1", y0=0, y1="count")
scene

Options

Keywords are snake_case.

minnumber | Date | expression
The low end of the range: a number, a Date, or an expression such as min("x") over the data around the slider. Default: 0.
maxnumber | Date | expression
The high end of the range: a number, a Date, or an expression such as max("x"). Default: 1.
stepnumber | string | {unit, step}
The distance between values; over Dates, a calendar interval such as "1 month" (which lands on month starts) or milliseconds. Default: any value.
valuenumber | Date | [number, number] | [Date, Date] | expression
The initial value, or [lower, upper] for two thumbs selecting an interval. Endpoints are sorted and clamped to min/max; an expression reads the data. Default: min.
formatstring | (value) => string
How the value is shown: a d3-format string such as ".2f", a %-pattern such as "%b %Y" over Dates, or (in JavaScript) a function. Default: a numeric step's decimals, else 4 significant digits (12,346); over Dates, by the step, as an axis labels them.
timezonestring
Over Dates, the time zone its steps and labels are in: an IANA name, "UTC" or "Local". Default: the zone of the datetime column min or max reads, else UTC.
namestring
The name readers use (input("name"), hm.input.name, or "$name" where a string names a column): an identifier, unique in its input context.
labelstring
The text shown beside the control. Default: the name.

Usage

Use a scalar value for one thumb or [lower, upper] for two thumbs selecting an interval. Endpoints are sorted and clamped to min and max; either numbers or Dates work, including calendar steps. Both thumbs support keyboard arrows and cannot cross. This replaces RangeSlider. In Svelte, bind the interval with bind:value; in Python, read it with hm.input.name, for example as a plot domain.

An input sends its value up to the nearest input context (an InputContext, a Python Scene, or a Template instance), and everything in that context reads it by name: input("name") in JavaScript, hm.input.name in Python, or the string "$name" where a string names a column. A read is replaced by the value before its reader sees it, so moving an input re-runs its readers once, and the change animates like any other data change. Inputs go beside Plots (in a Row or Column), not inside them.

Related examples

Inputs