Title
A heading or note beside plots, drawn as text that stays text in SVG and PDF exports.
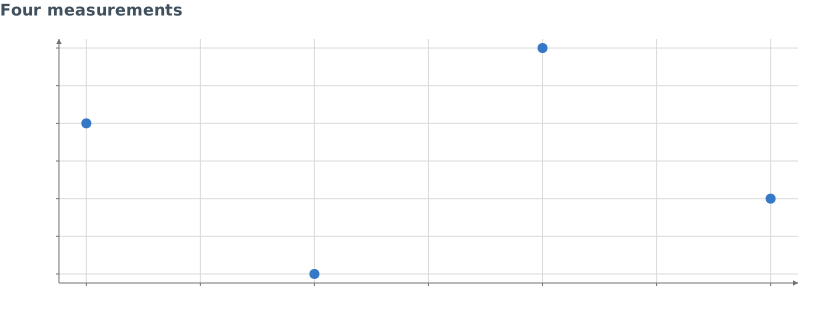
Static preview; loading the interactive plot
import hmplot as hm

data = {"x": [1, 2, 3, 4], "y": [3, 1, 4, 2]}
with hm.Scene() as scene:
    hm.Title("Four measurements")
    with hm.Plot(data=data, height=300, axes2d=True):
        hm.Points(x="x", y="y")
scene
Usage
Title is plain text for a layout: a figure’s heading, a note between plots, a caption under a grid. Its lines break at "\n" and wrap at the block’s width in the loaded font, and they are drawn as SVG text, so a scene’s SVG and PDF exports carry the same lines as vector, searchable text (in the embedded default font). size picks the theme’s title, subtitle or caption size, or takes pixels. {$name} shows an input’s value as the input shows it and follows it: "Temperature anomaly, {$year}".
A Title inside a Data is also a readout (a KPI, a live count): its text can hold live values, reductions over that data that follow it and its selections, written as tooltips write numbers or in a d3 format, "—" when no row has one. In Python an f-string does it; in Svelte text is a list of parts:
with hm.Data(trips):
    hm.Title(f"Selected trips: {hm.count(where='@brushed'):,} · mean fare {hm.mean('fare', where='@brushed'):$.2f}")
    with hm.Plot():
hm.Points(x="distance", y="fare", brush=True)<Title text={["Selected trips: ", count({ where: "@brushed" }), " · mean fare ", { value: mean("fare", { where: "@brushed" }), format: "$.2f" }]} />An expression in an f-string is only a live value in Title’s text; elsewhere it is an error. For a number beside the data inside a plot, use Text of a Group’s column.
Use Title for publications; Markdown (Python layouts) is for dashboards and exports as an image. A plot’s own heading is its title, subtitle and caption.