Titles, bands and callouts
A plot's title, subtitle and caption are part of the plot and its exports; bands shade a span of an axis behind the marks and grid; callouts point at a value with a note.
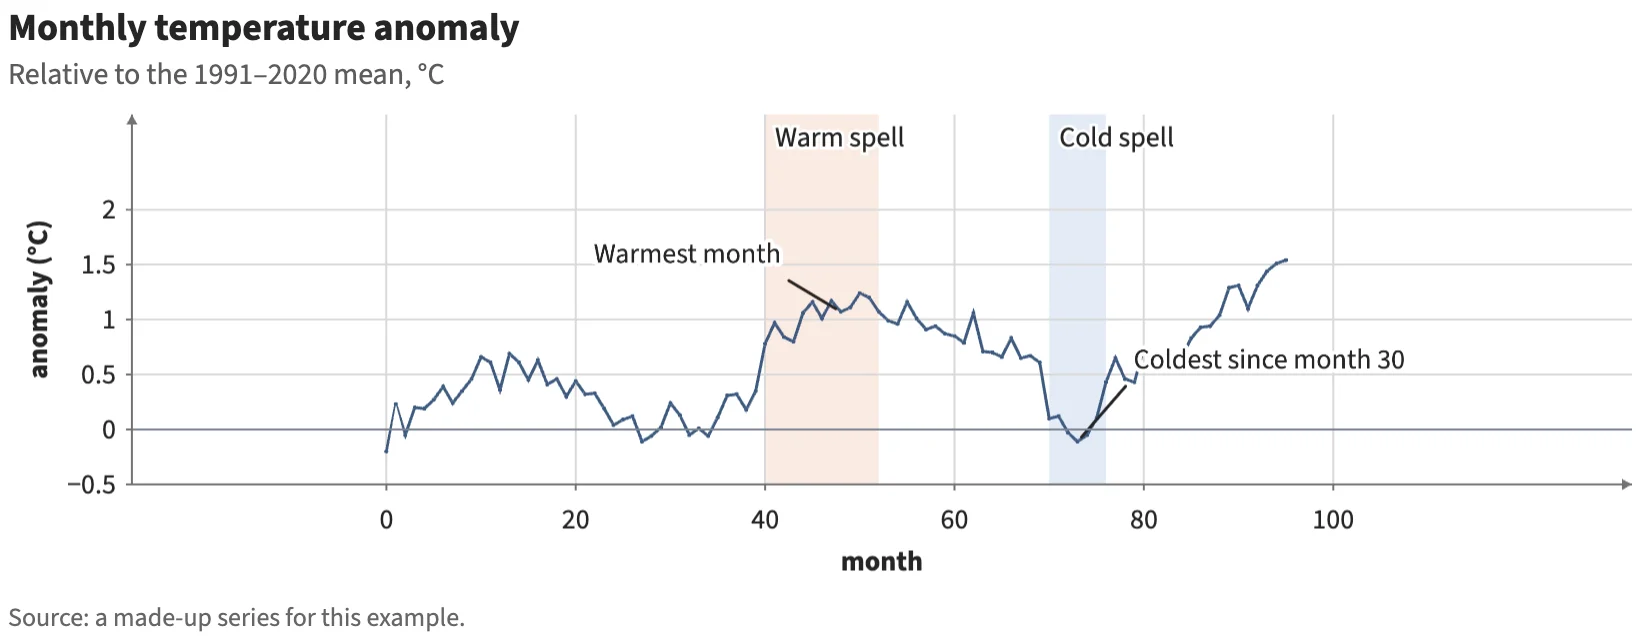
Static preview; loading the interactive plot
<script>
  import { Plot, Line, Points } from "hmplot";
import { Callout } from "hmplot/charts";
  // A made-up monthly temperature anomaly, with a warm spell and a cold spell.
  const noise = (i) => { const v = Math.sin(i * 12.9898) * 43758.5453; return v - Math.floor(v); };
  const series = { month: [], anomaly: [] };
  for (let i = 0; i < 96; i++) {
    series.month.push(i);
    series.anomaly.push(Math.round((0.012 * i + 0.35 * Math.sin(i / 7) + (noise(i) - 0.5) * 0.4 + (i >= 40 && i < 52 ? 0.45 : 0) - (i >= 70 && i < 76 ? 0.5 : 0)) * 100) / 100);
  }
</script>

<Plot data={series} responsive height={320} axes2d
  title="Monthly temperature anomaly" subtitle="Relative to the 1991–2020 mean, °C"
  caption="Source: a made-up series for this example."
  x={{ label: "month" }} y={{ label: "anomaly (°C)" }}
  rules={[{ axis: "y", value: 0, color: "#7a8392" }]}
  bands={[{ axis: "x", from: 40, to: 52, label: "Warm spell", color: "#d9824b", opacity: 0.16 },
    { axis: "x", from: 70, to: 76, label: "Cold spell", color: "#4f86c6", opacity: 0.16 }]}>
  <Line x="month" y="anomaly" color="#3d5a80" width={1.5} />
  <Points x="month" y="anomaly" size={2} fill="#3d5a80" />
  <Callout x={48} y={series.anomaly[48]} text="Warmest month" dx={-30} dy={-28} />
  <Callout x={73} y={series.anomaly[73]} text="Coldest since month 30" dx={28} dy={-40} />
</Plot>