One density per group, one frame
Partition repeats its children once per group inside a single frame, sharing the parent's scales, axes, and legend. Here a Density transform runs per species so the curves overlay; Facet would give each species its own cell instead.
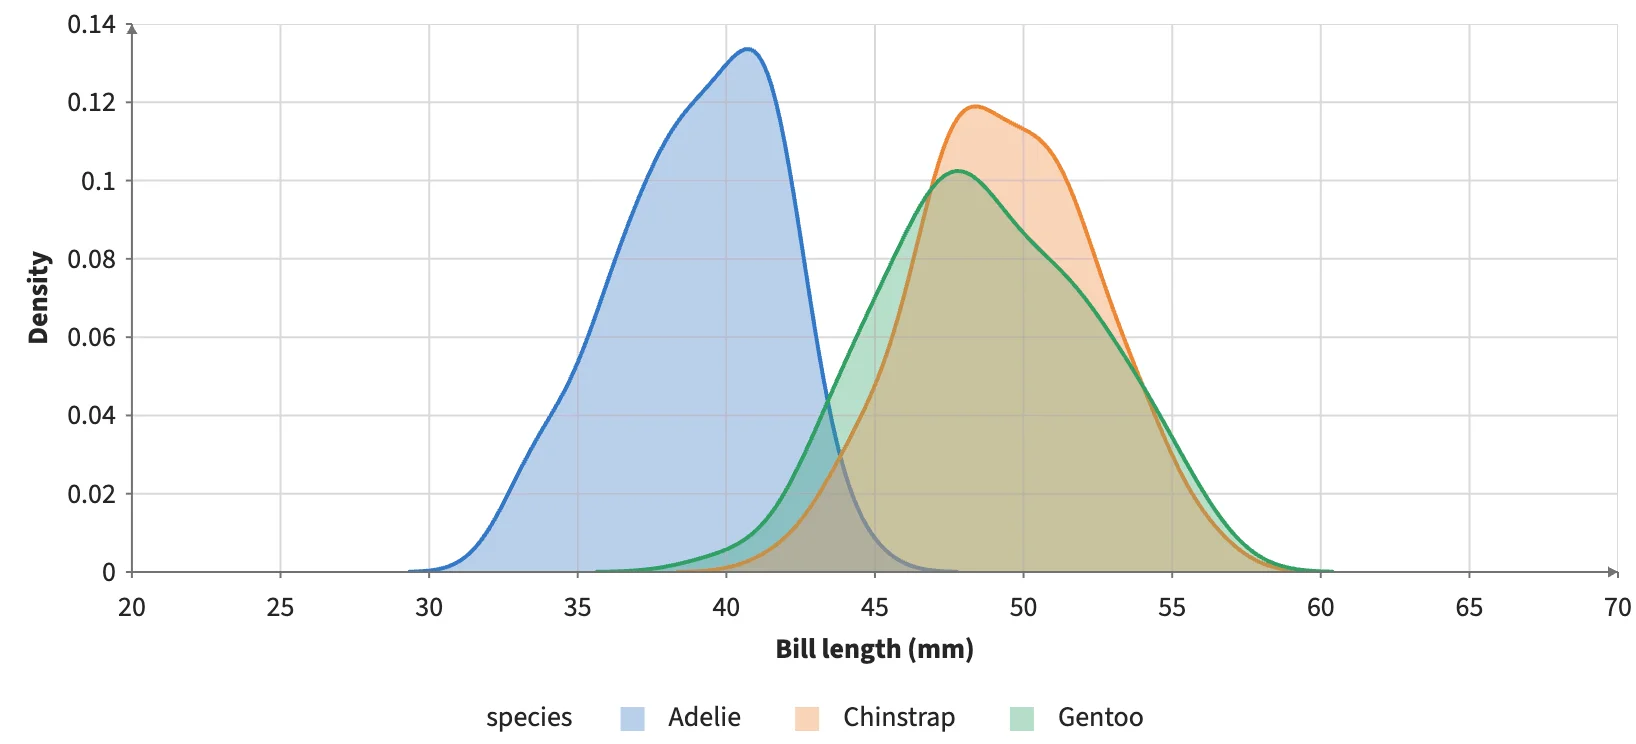
Static preview; loading the interactive plot
<script>
  import { Plot, Partition, Density, Area, Line } from "hmplot";
</script>
<Plot data={penguins} responsive height={380} axes2d legend>
  <Partition by="species" legendGroups>
    <Density x="bill_length" resolution={128}>
      <Area x="x" upper="density" fill="species" opacity={0.35} />
      <Line x="x" y="density" color="species" width={2} />
    </Density>
  </Partition>
</Plot>