Calendar functions and a Playback over dates
Mauna Loa's monthly CO2: a Playback whose value is a date draws it a month at a time, four years a second, and month_name groups the seasonal cycle by calendar month.
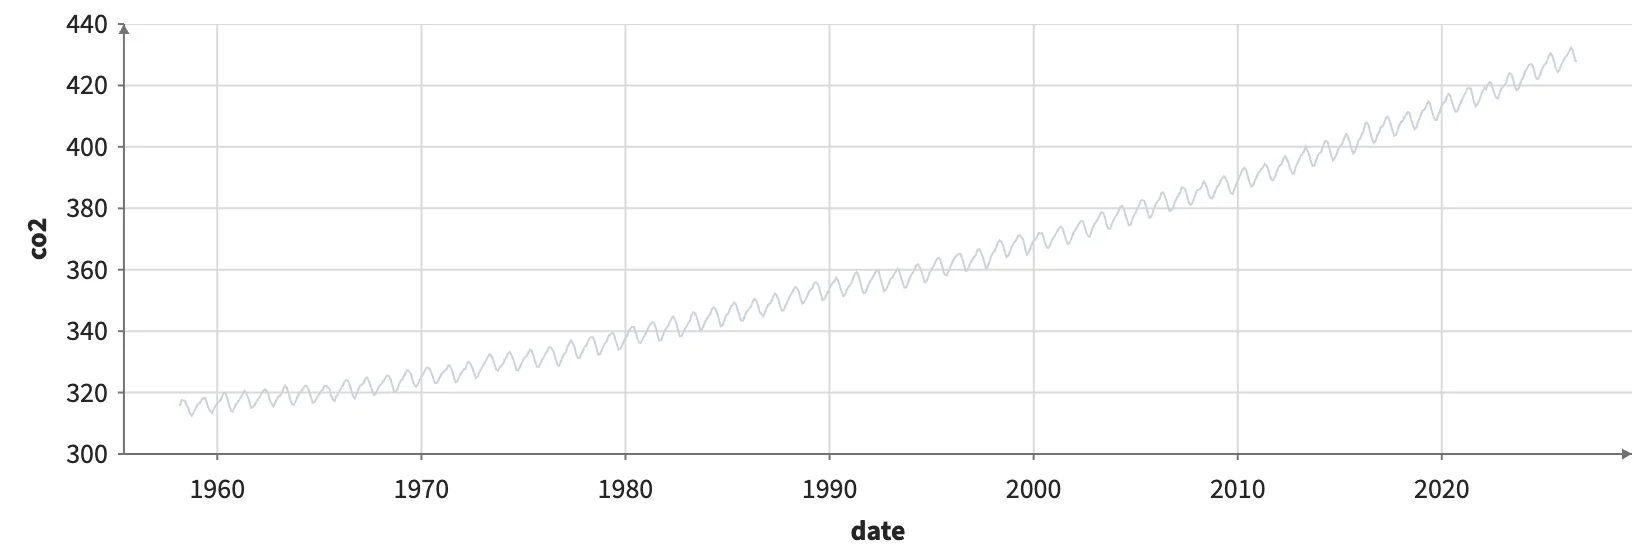
Static preview; loading the interactive plot
<InputContext>
  <Provider url="/data/co2/mauna-loa-co2-monthly.csv" format="csv" schema={{ date: "datetime" }}>
    <Playback name="until" min={min("date")} max={max("date")} rate="4 years" step="1 month" loop />
    <Plot axes2d>
      <Line x="date" y="co2" color="#c9d3dd" />
      <Filter where={less_equal("date", input("until"))}><Line x="date" y="co2" /></Filter>
    </Plot>
    <Calculate columns={{ month: month_name("date"), seasonal: subtract("co2", "deseasonalized") }}>
      <Group by="month" columns={{ cycle: mean("seasonal") }}>
        <Plot axes2d><Bar x="month" y="cycle" /></Plot>
      </Group>
    </Calculate>
  </Provider>
</InputContext>