Before and after arrows
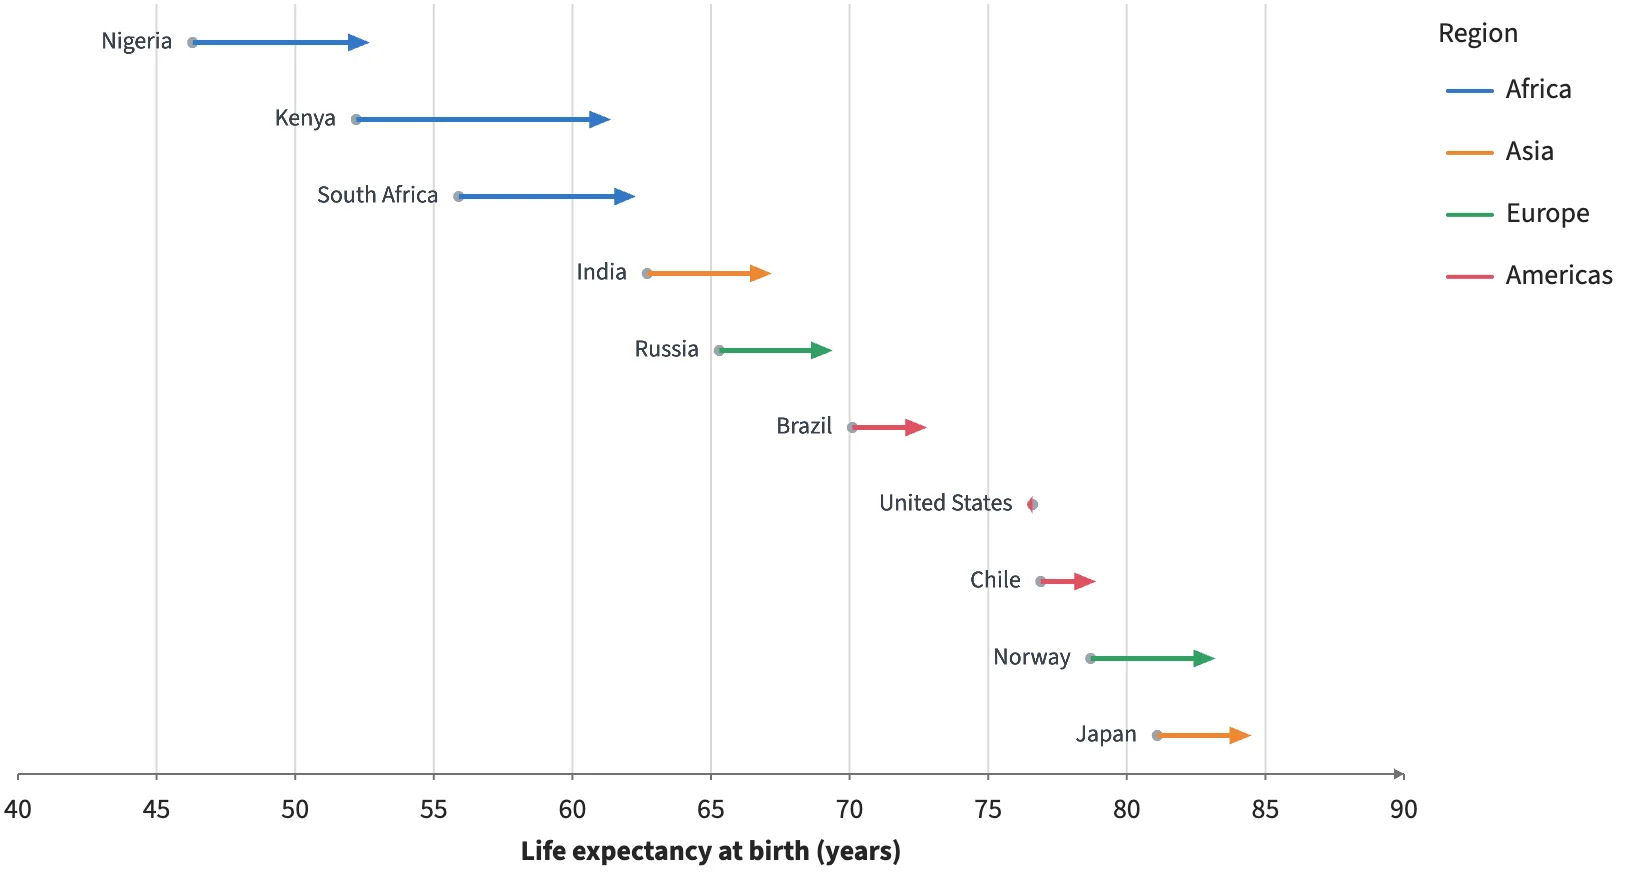
connect() pairs two marks' rows by key and draws one arrow per pair. The 2000 values are points, the 2021 values an invisible Anchor, and the arrows take their color from the shared table.
Static preview; loading the interactive plot
<script>
  import { Plot, Points, Anchor, Text, Legend, connect } from "hmplot";
import { Arrows } from "hmplot/charts";
  let before = $state(), after = $state(), arrows = $state();
  // Illustrative life expectancy at birth (years), 2000 and 2021.
  const data = {
    country: ["Nigeria", "Kenya", "South Africa", "India", "Russia", "Brazil", "United States", "Chile", "Norway", "Japan"],
    region: ["Africa", "Africa", "Africa", "Asia", "Europe", "Americas", "Americas", "Americas", "Europe", "Asia"],
    y2000: [46.3, 52.2, 55.9, 62.7, 65.3, 70.1, 76.6, 76.9, 78.7, 81.1],
    y2021: [52.7, 61.4, 62.3, 67.2, 69.4, 72.8, 76.4, 78.9, 83.2, 84.5],
  };
</script>
<Plot {data} responsive height={440} axes2d
  x={{ label: "Life expectancy at birth (years)", domain: [40, 90] }} y={{ visible: false }}>
  <Points bind:this={before} x="y2000" y="country" size={5.5} fill="#9aa3ad" />
  <Text x="y2000" y="country" text="country" align="right" dx={-10} size={12} color="#39424d" />
  <Anchor bind:this={after} x="y2021" y="country" />
  <Arrows bind:this={arrows} connections={connect(before, after, { key: "country" })}
    color="region" width={2.5} headLength={11} headWidth={9} />
  <Legend for={arrows} channel="color" label="Region" position="right" />
</Plot>