Streamgraph
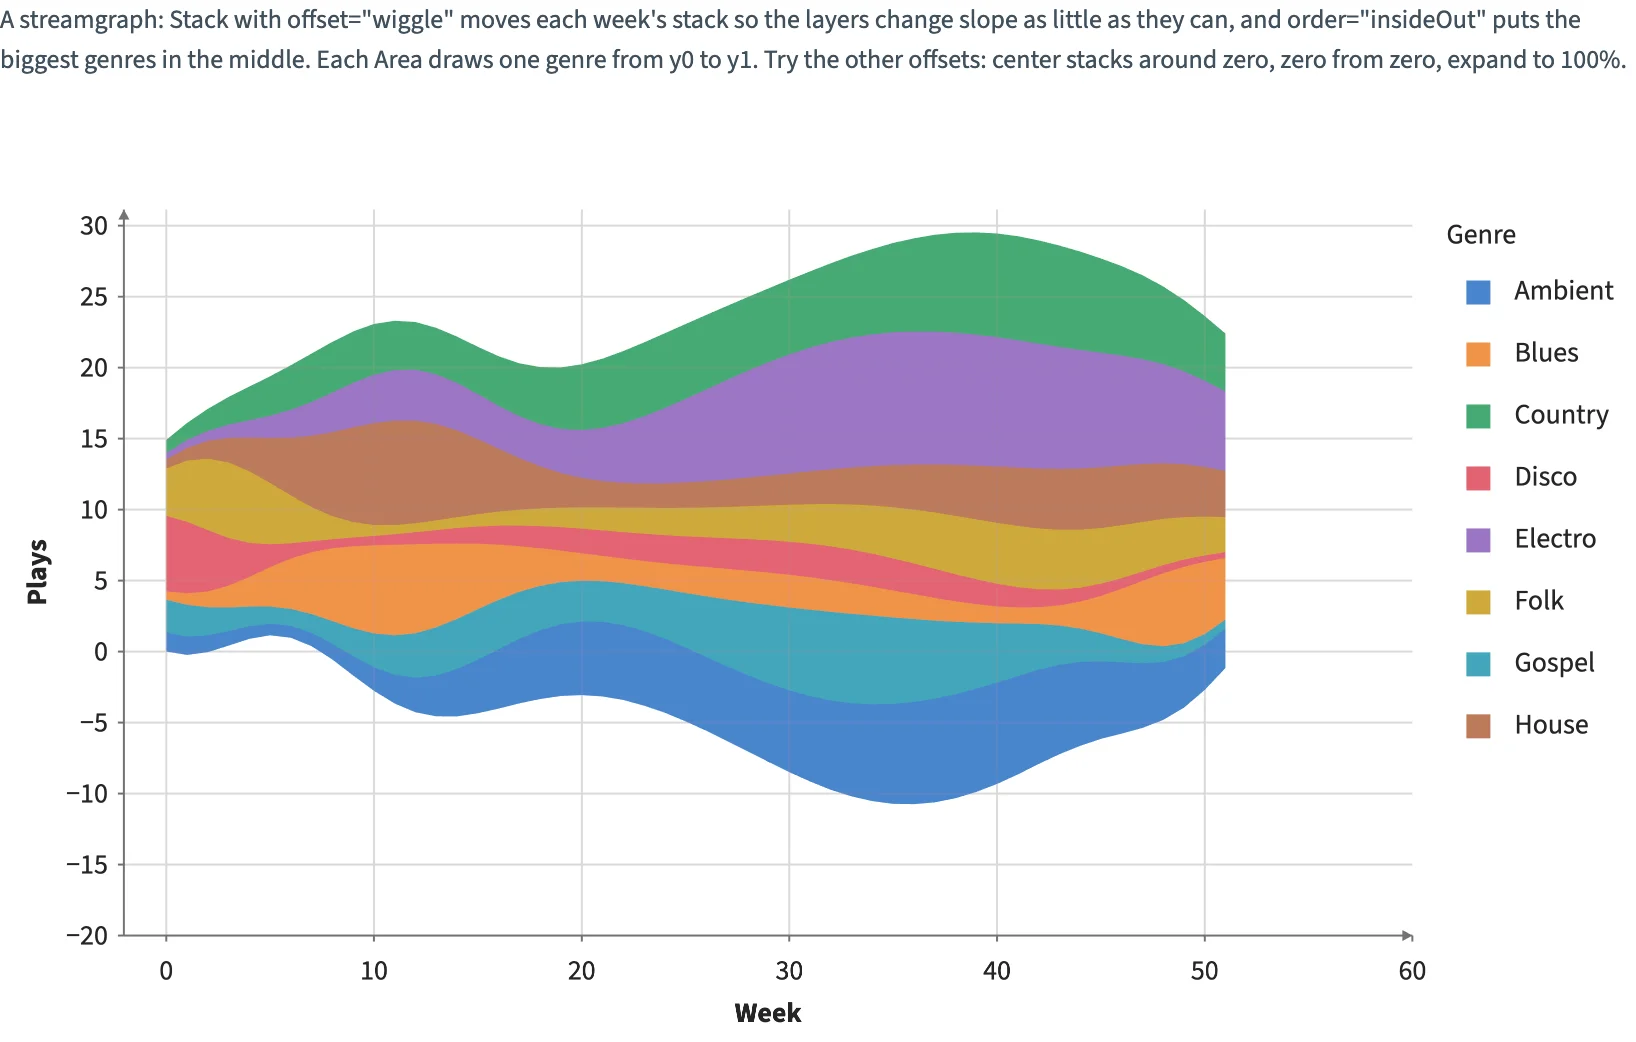
Stack with offset="wiggle" and order="insideOut": each week's stack moves so the layers change slope as little as they can, the biggest genres in the middle, and an Area per genre draws it. The controls switch the offset and the order. Area transitions animate by default; the Animate control can turn them off.
Static preview; loading the interactive plot
<script>
  import { Plot, Stack, Area, Legend, InputContext, Select, Checkbox, input } from "hmplot";
  import { untrack } from "svelte";
  let { onready } = $props(), plot = $state(), area = $state(), stack = $state();
  // Weekly plays of eight genres over a year, each a few bumps: one row per genre and week.
  const genres = ["Ambient", "Blues", "Country", "Disco", "Electro", "Folk", "Gospel", "House"];
  const week = [], genre = [], plays = [];
  genres.forEach((name, g) => {
    for (let t = 0; t < 52; t++) {
      let value = 0.3;
      for (let k = 0; k < 3; k++) {
        const peak = (g * 11 + k * 19) % 52, spread = 3 + ((g + 2 * k) % 5) * 1.5, height = 1 + ((g * 5 + k * 3) % 7);
        value += height * Math.exp(-((t - peak) ** 2) / (2 * spread ** 2));
      }
      week.push(t);
      genre.push(name);
      plays.push(Math.round(value * 100) / 100);
    }
  });
  const data = { week, genre, plays };
  let animate = $state(true);
  $effect(() => { const p = plot; untrack(() => onready?.(p)); });
  $effect(() => {
    if (!import.meta.env.DEV || !plot || !area || !stack) return;
    window.__streamgraph = { plot, area, stack };
    return () => { delete window.__streamgraph; };
  });
</script>
<p>A streamgraph: Stack with offset="wiggle" moves each week's stack so the layers change slope as little as they can, and order="insideOut" puts the biggest genres in the middle. Each Area draws one genre from y0 to y1. Try the other offsets: center stacks around zero, zero from zero, expand to 100%.</p>
<InputContext>
  <div class="controls">
    <Select name="offset" options={["wiggle", "center", "zero", "expand"]} label="Offset" />
    <Select name="order" options={["insideOut", "none", "appearance", "ascending", "descending", "reverse"]} label="Order" />
    <Checkbox name="animate" label="Animate" bind:value={animate} />
  </div>
  <Plot bind:this={plot} {data} responsive height={420} axes2d animateBounds={animate} boundsDuration={700}
    x={{ label: "Week" }} y={{ label: "Plays" }}>
    <Stack bind:this={stack} x="week" y="plays" series="genre" offset={input("offset")} order={input("order")}>
      <Area bind:this={area} x="week" upper="y1" lower="y0" fill="genre" series="genre" opacity={0.9} animation={animate} animationDuration={700} />
    </Stack>
    <Legend channel="fill" label="Genre" position="right" />
  </Plot>
</InputContext>
<style>p {font-size:14px;line-height:1.5}.controls{display:flex;gap:12px;align-items:center;flex-wrap:wrap;margin-bottom:10px}</style>