Nested scales
A child interval maps through its parent’s logarithmic scale.
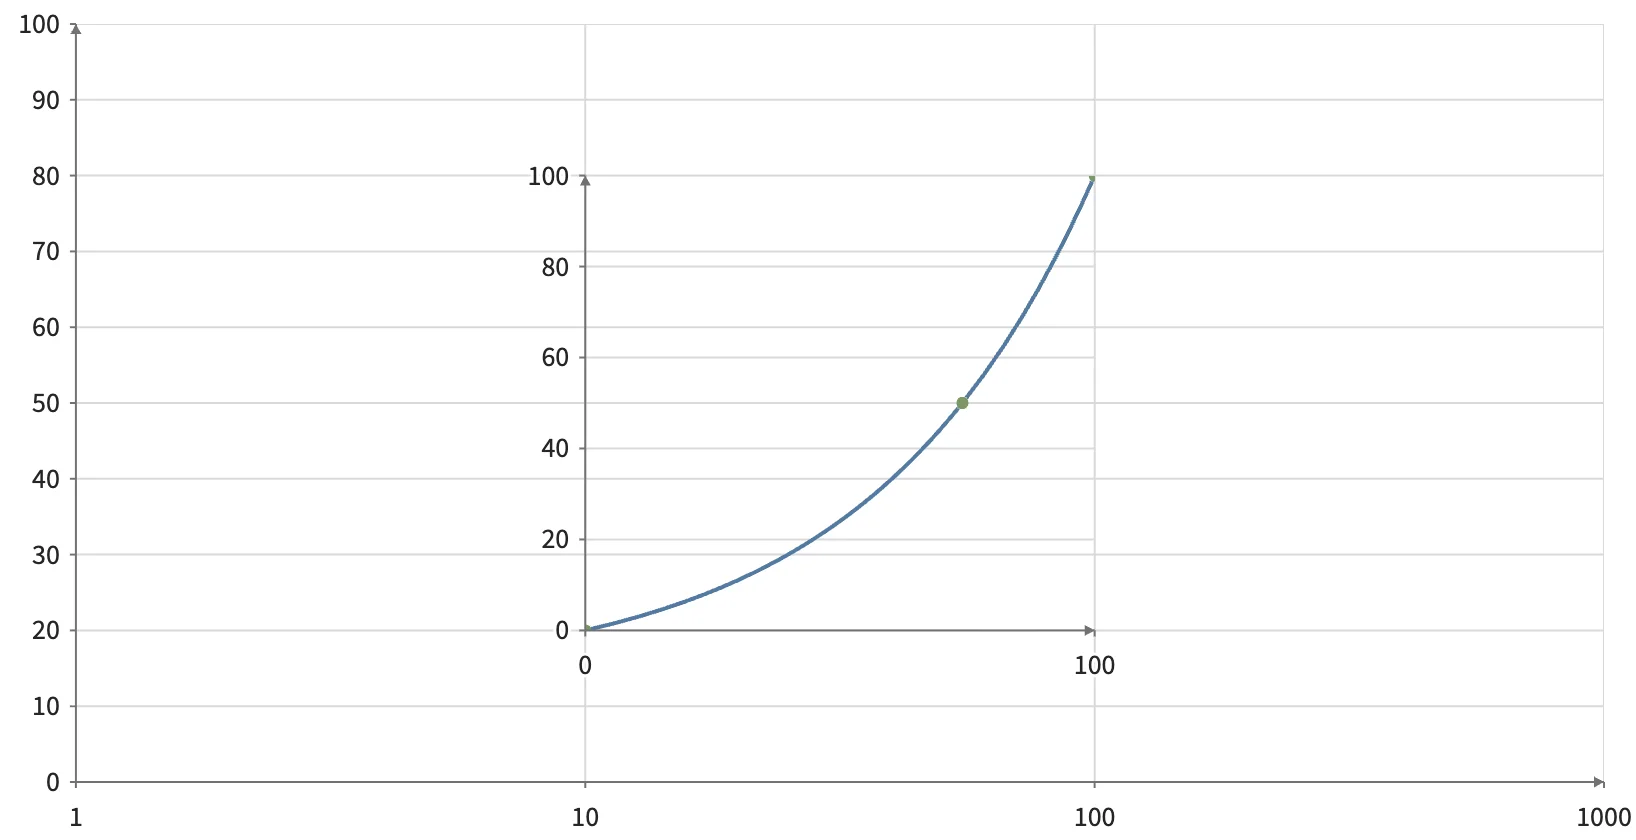
Static preview; loading the interactive plot
<script>
  import { Plot, Frame, Points, Line } from "hmplot";
  const positions = [[0, 0], [50, 50], [100, 100]];
</script>
<Plot responsive height={420} axes2d
  x={{domain:[1,1000], transform:"log"}} y={{domain:[0,100]}}>
  <Frame x={{domain:[0,100], range:[10,100]}}
    y={{domain:[0,100], range:[20,80]}}>
    <Line position={positions} color="#547ba2" width={2} />
    <Points position={positions} fill="#7b9865" size={6} />
  </Frame>
</Plot>