Quantiles and group summaries
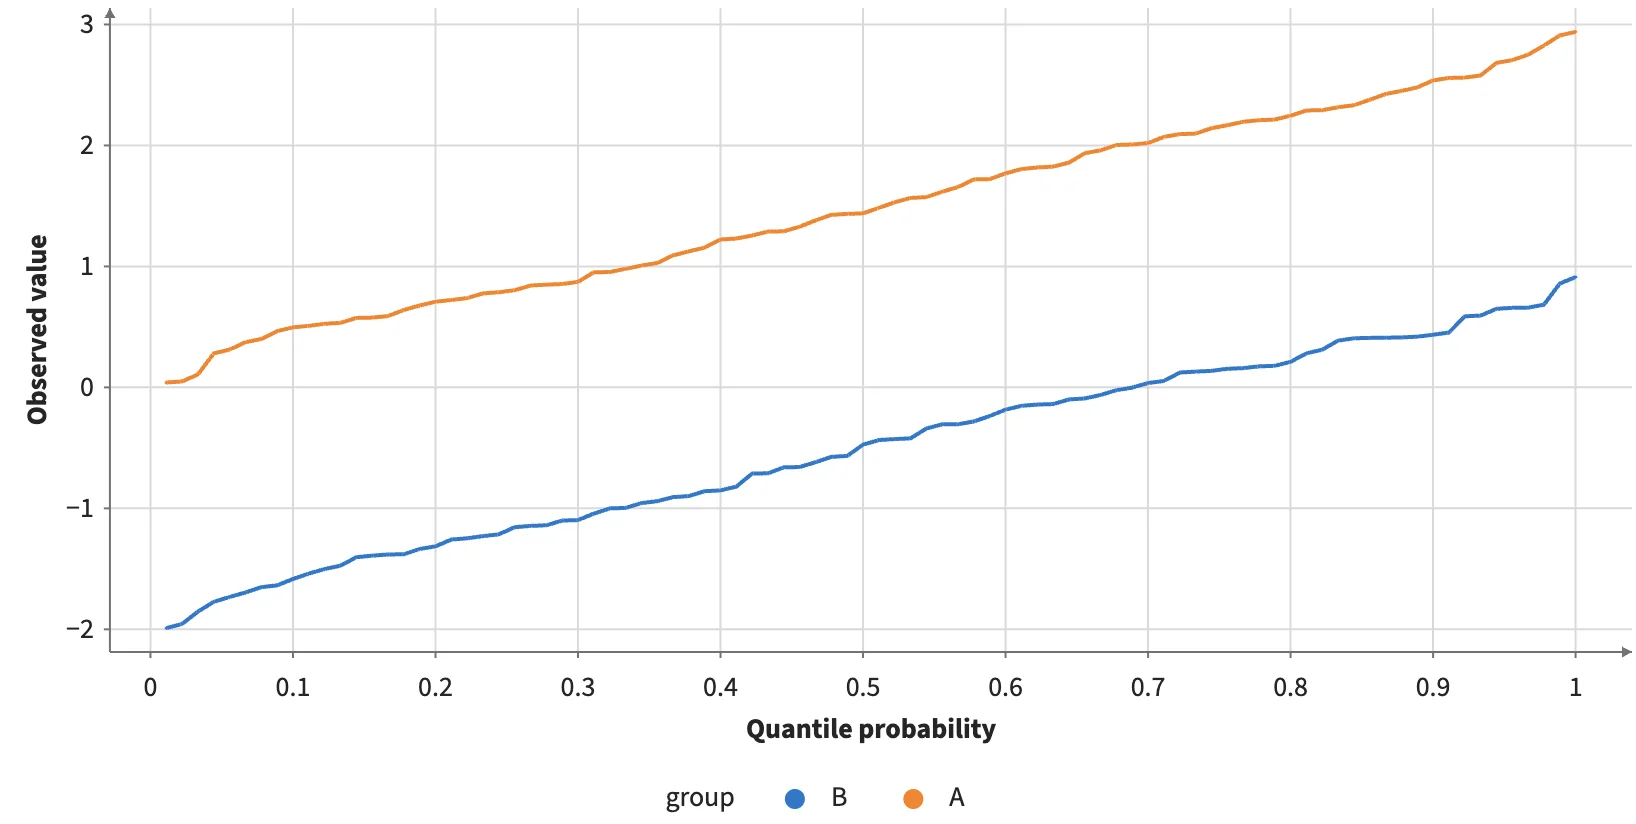
Grouped quantile curves and each row's group mean and 90th percentile, all Calculate expressions.
Static preview; loading the interactive plot
<Sort by="value"><Calculate columns={{ probability: divide(cumsum(is_finite("value"), { by: "group", orderBy: "value" }), count("value", { by: "group" })) }}><Line x="probability" y="value" series="group" color="group" /></Calculate></Sort>