Joining two tables
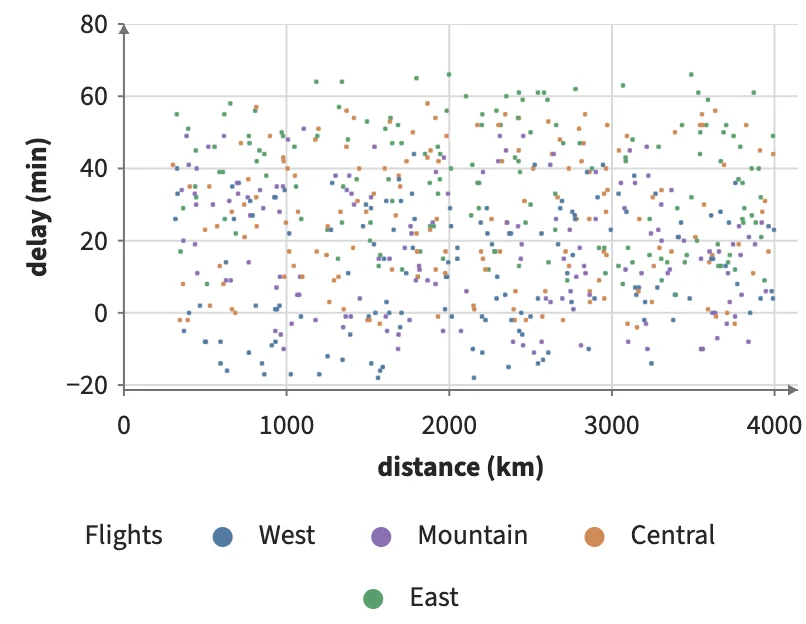
Flights name their origin airport by code; Join adds each airport's region from a second table, so the flights are colored, grouped on an axis and brushed by it.
Static preview; loading the interactive plot
<script>
  import { Data, Join, Plot, Points } from "hmplot";
  const airports = { code: ["SEA", "DEN", "ORD", "JFK"], region: ["West", "Mountain", "Central", "East"] };
  const flights = { id: [0, 1, 2, 3, 4], origin: ["SEA", "JFK", "ORD", "SEA", "DEN"],
    distance: [1100, 2400, 700, 3800, 1600], delay: [5, 31, -4, 12, 18] };
</script>
<Data value={flights} key="id">
  <!-- Each flight gets its origin airport's region: a column from the second table, by key. -->
  <Join data={airports} leftOn="origin" rightOn="code" fields={["region"]}>
    <Plot axes2d><Points x="distance" y="delay" fill="region" respond="brushed" /></Plot>
    <Plot axes2d><Points x="region" y="delay" fill="region" brush={{ axis: "x" }} /></Plot>
  </Join>
</Data>