100% stacked bars
Stack with offset="expand" scales each region's stack to span 0 to 1, so each Bar segment is a product's share of the region's sales.
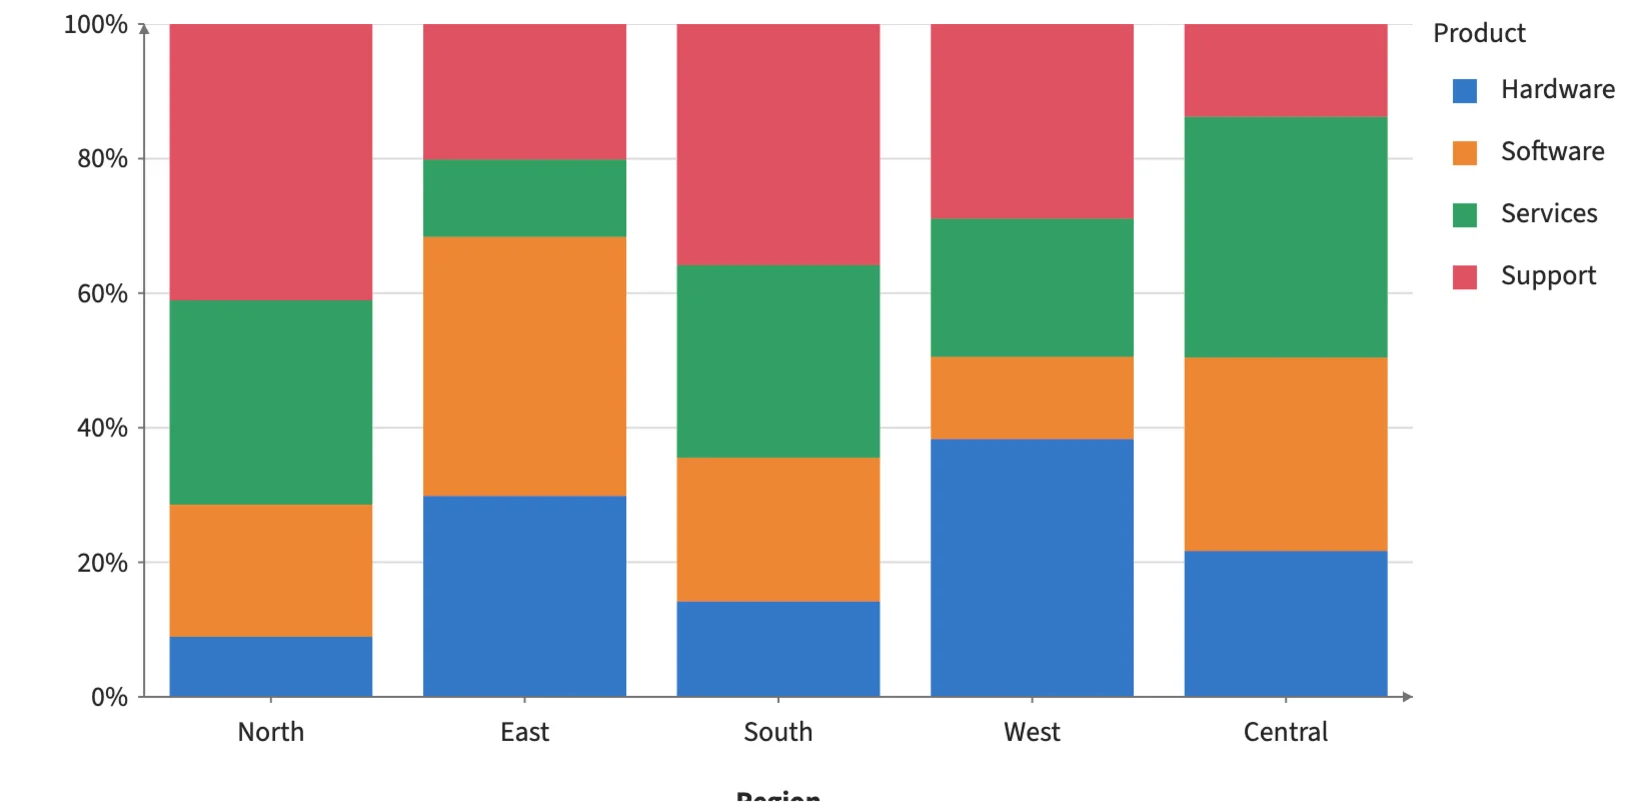
Static preview; loading the interactive plot
<Stack x="region" y="sales" series="product" offset="expand">
  <Bar x="region" y="y1" baseline="y0" fill="product" />
</Stack>