Data
A table whose columns the components inside it read by name.
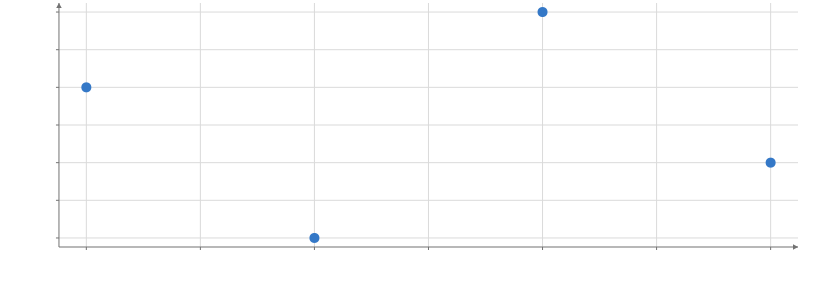
Static preview; loading the interactive plot
<script>
  import { Data, Plot, Points } from "hmplot";
  const data = { x: [1, 2, 3, 4], y: [3, 1, 4, 2] };
</script>

<Data value={data}>
  <Plot height={300} axes2d>
    <Points x="x" y="y" />
  </Plot>
</Data>
Usage
value accepts column tables, row records, and FeatureCollections. Nested Data replaces the active table. Plot and Facet data shortcuts establish the same scope. A key keeps observation identity stable through reorderings.
A transform’s output
value can also be a transform: its live output, read where this Data is. A pipeline computed
once can feed several plots in different places, each mark keeping its own Plot or Frame as
its visual parent. In Python pass the transform node, hm.Data(value=totals), or a mark’s data=totals; in Svelte its handle, bind:this={totals} then <Data value={totals}>.
with hm.Scene():
    with hm.Data(sales):
        with hm.Filter(where=hm.col.amount > 20):
            totals = hm.Group(by="region", columns={"orders": hm.count()})
    with hm.Row():
        with hm.Plot():
            hm.Points(data=totals, x="region", y="orders", select=True)
        with hm.Plot():
            with hm.Data(value=totals):
hm.Points(x="region", y="orders", respond="selected")<script>
import { Data, Filter, Group, Plot, Points, count, greater } from "hmplot";
let { sales } = $props();
let totals = $state();
</script>
<Data value={sales}>
<Filter where={greater("amount", 20)}>
<Group bind:this={totals} by="region" columns={{ orders: count() }} />
</Filter>
</Data>
{#if totals}
<Plot data={totals}><Points x="region" y="orders" select /></Plot>
<Plot><Data value={totals}><Points x="region" y="orders" respond="selected" /></Data></Plot>
{/if}- The pipeline runs once per change of its inputs, however many plots read it, and every reader draws the same output; removing one reader leaves the others drawing.
- The connection is fixed: a Data reads the transform it was given for its life. Define the
transform before its consumers. Python automatically includes a detached pipeline rooted at
hm.Data(table)in each scene that reads it; a transform already parented to another Scene cannot be imported this way. A pipeline never reads its own output (an error names the cycle). - Selections and other interaction state are the source table’s: a click on one plot’s group selects its rows, which every reader of the pipeline sees.
- A transform reading the view (
@time, the pointer) takes the clock of the plots drawing it. Plots with their own clocks are ambiguous and reported; put them in one InputContext. - An HTML export of the whole scene keeps the references; exporting one plot whose data is a
pipeline outside it is refused. Put the views in an explicit
with hm.Scene() as chart:and exportchart; the same rule applies to a Row containing views of a detached chain. - A positional
hm.Data(node)adds the node as a child, as for any container: passvalue=to read a transform’s output.
Reading the rows
read() on a transform’s handle, or on a Data’s (bind:this gives a DataHandle), gives the rows it holds now, on the host:
for a value the page shows outside a plot, such as a total in a sentence, a breadcrumb or a
list. It waits for the current inputs to run, then returns { length, version, columns }:
numbers as Float64Array (NaN where missing), times as Date, categories as their values
(null where missing). read({ columns: ["region", "orders"] }) picks and orders the columns; read({ rows: true }) gives one object per row instead. In Python, await totals.read() in a
displayed scene gives a dict of NumPy arrays (pandas.DataFrame(await totals.read())).
<script>
  let totals = $state(), top = $state([]);
  // subscribe() says when the output changes; read() fetches it.
  $effect(() => totals?.subscribe(async (status) => {
    if (status.pending || status.error) return;
    const { rows } = await totals.read({ rows: true });
    top = rows.sort((a, b) => b.orders - a.orders).slice(0, 10);
  }));
</script>
table = await totals.read(["region", "orders"])- A read copies the columns from the GPU: one wait per call, and its size is bounded by
limit.readback(16 MiB). Marks draw the same output without it; never read on every pointer move to redraw what a mark could draw. - The rows are the visible ones, in the output’s order: a Filter’s kept rows, a Group’s groups.
versionnames the output it was read from; two reads with the same version hold the same rows. A brush or an input that changes the rows publishes a new version.- A Group of the brushed rows (
Filter where="@brushed"above it) reads the brushed rows’ statistics; a selection resource’srows()reads which source rows are selected.
Use rows=N instead of value to generate rows without uploading a table. Pass one or the other. row() (hm.row()) gives the zero-based position among visible rows; numeric constants and
seeded random() expressions provide generated values. Retain a source index or random draw
in [Calculate] before filtering or sampling when it should follow the original row.
The count is an integer from 0 to 2147483647, subject to device memory for generated arrays.
animationGroup (animation_group in Python) on Data, Plot or Frame matches animated
rows by a column or list of columns independently of Data keys. It inherits through the
tree; a child Frame overrides its branch, and explicit null (Python None) restores
Data-key/position matching. Filter to one row per group before tweening: a country/year
table can keep key=["country", "year"] and animate by "country" after filtering
to one year. Groups must be unique in each tweened snapshot, and changing the group
column scheme resets motion history. Selection, hover and connections keep Data identity.