HMPlot

Voronoi

Each point's Voronoi cell, as triangles for Polygon.
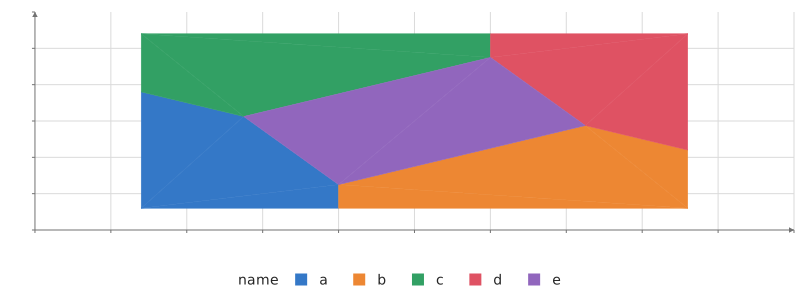
Polygons, colored by name (a, b, c, d, e). x from 0 to 5, y from 0.5 to 3.5. 14 rows.

Static preview; loading the interactive plot

<script>
  import { Plot, Voronoi, Polygon } from "hmplot";
  const data = { name: ["a", "b", "c", "d", "e"], x: [1, 3, 2, 4, 2.5], y: [1, 1, 3, 3, 2] };
</script>

<Plot {data} height={300} axes2d>
  <Voronoi x="x" y="y">
    <Polygon fill="name" />
  </Voronoi>
</Plot>

Options

namestring
Names the transform, so a Facet's getTransform(name) reaches its copy in every cell.
xcolumn
The points' x column. Each cell carries its point's row: its columns, and its identity for hover and selection.
ycolumn
The points' y column.
extent[[number, number], [number, number]]
The rectangle the cells are clipped to, [[x0, y0], [x1, y1]]. Default: the points' bounds, widened by a tenth of their size. In data units.

Usage

Voronoi makes each point’s cell, clipped to extent (default: the points’ bounds and a tenth around them), as triangles for Polygon. Each cell’s triangles carry its point’s row, so hovering a cell highlights its point.

Related examples

Voronoi cells, hulls and a Delaunay triangulation