HMPlot

Bin

Counts the rows in each interval of x (a histogram), or in each cell of an x-y or x-y-z grid.
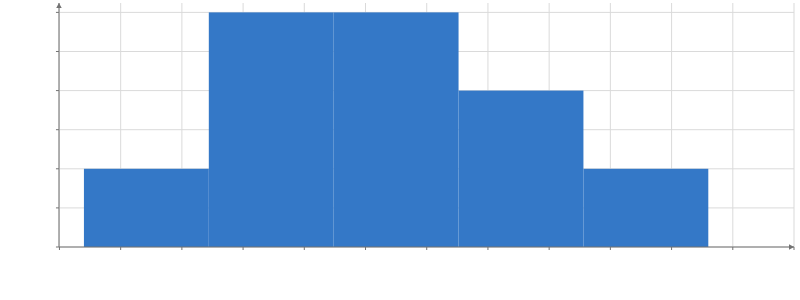
Rectangles of count against value. x from 1 to 7, y from 0 to 3.1. 5 rectangles.

Static preview; loading the interactive plot

<script>
  import { Plot, Rect } from "hmplot";
import { Bin } from "hmplot/stats";
  const data = { value: [1.2, 2.5, 2.9, 3.1, 3.4, 3.8, 4.2, 4.4, 5.1, 6.3] };
</script>

<Plot {data} height={300} axes2d>
  <Bin x="value" bins={5}>
    <Rect x0="x0" x1="x1" y0={0} y1="count" />
  </Bin>
</Plot>

Options

namestring
Names the transform, so a Facet's getTransform(name) reaches its copy in every cell.
xchannel
The values to bin along x; each bin's row gets x0 and x1 (its edges) and x (its center).
ychannel
The values to bin along y, for a 2D grid of bins; each bin gets y0, y1 and y.
zchannel
The values to bin along z, for a 3D grid of bins; each bin gets z0, z1 and z.
binsnumber | expression | number[] | "auto" | "sturges" | "fd" | "scott" | {x, y, z}
How many equal-width bins span the data, the edges themselves (Dates on a datetime axis), a rule that picks the count as numpy does, or an expression such as `power(count(col.x), 0.5)`; {x, y, z} sets each axis. Default: 30.
intervalstring | {x, y, z}
For a datetime column, the calendar interval each bin spans, such as "1 month", "1 week" or "6 hours" (weeks start on Sunday); {x, y, z} sets each axis. Default: the interval axis ticks would use for `bins` bins.
tzstring | {x, y, z}
The time zone of a datetime column's calendar bins: an IANA name, "UTC" or "Local"; {x, y, z} sets each axis. Default: the column's own, else UTC.
mode"aggregate" | "assign"
"aggregate" gives one row per bin, with its count; "assign" keeps the input rows and adds each row's bin: binX (its index), binX0 and binX1 (its edges), and likewise for y and z. Default: "aggregate".
sharedBinsboolean
In a Facet, gives every cell the same edges, with a rule or expression resolved over all the cells' rows; false bins each cell on its own. Default: true.
emptyboolean
Show the bins no row falls in; false hides them. Default: true.
normalization"count" | "proportion" | "density"
Gives a histogram's bars, binning x alone (or y alone): each bin also gets y0 (0), y1 and y (x0, x1 and x for bins along y) holding its rows' count, their share of all the rows ("proportion"), or that share divided by the bin's width ("density"), so one Rect x0="x0" x1="x1" y0="y0" y1="y1" draws either orientation.
columns{[name]: expression}
Columns to compute over each bin's rows besides count, each a reduction expression as in Calculate: {mean_y: mean("y")}, Python {"mean_y": hm.mean("y")}. Every reduction reduces the bin's visible rows; an empty bin's column is missing.
as{[column]: string}
New names for the output columns, such as {count: "n", x0: "left"}.
weightcolumn
A column, or one number per row, that scales each row's contribution to count(), sum(x) and mean(x) columns (other columns leave out rows of weight 0; with a column weight, a sum, mean or count inside a larger expression is an error). An interaction column such as "@brushed" counts only those rows, and every row while there are none.

Usage

Outputs centers, lower/upper bounds per dimension, count, and columns: reduction expressions as in Group (columns={{ mean_y: mean("y") }}), missing for an empty bin. Defaults to 30 bins; bins may instead supply explicit edges. Aggregate mode includes empty rectangular bins; assign mode keeps original rows. Bins are half-open except for the last upper boundary.

For a histogram over x alone (or y alone), normalization gives each bin its bar along the other axis: y0 (0), y1 and y hold its count ("count"), its share of all the rows ("proportion"), or that share divided by the bin’s width ("density"); binning y gives x0, x1 and x instead. So <Rect x0="x0" x1="x1" y0="y0" y1="y1" /> draws the bars either way round, as Histogram does.

bins also takes a rule name — "auto", "sturges", "fd", or "scott", computed from the data exactly as numpy does — or an expression evaluated against this transform’s input, such as power(count(col.x), 0.5). Either way the count is resolved before binning, and re-resolved whenever the data changes. Changing a bin count changes the number of rows, so marks snap to the new bins rather than animating between them.

Inside a Facet, bins are shared across the cells by default, so a rule name or an expression is resolved once over the rows of every cell together and each cell gets the same edges. Set sharedBins={false} to resolve the count per cell, against that cell’s rows.

To let the viewer change a setting, read an input in it: bins={input("bins")} (Python bins=hm.input.bins), where bins is a Slider.

Related examples

Histogram bins