Segments
Line segments, one per row, each from its start to its end.
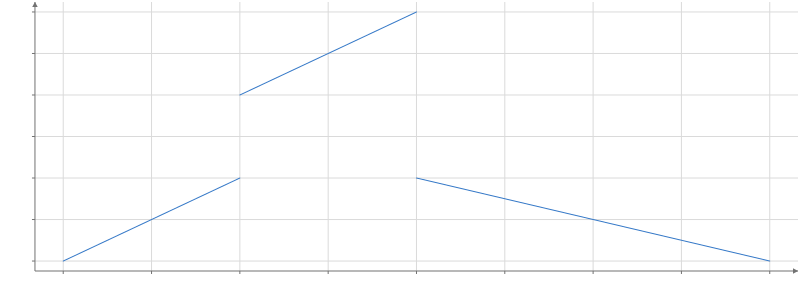 Static preview
; loading the interactive plot
<script>
  import { Plot, Segments } from "hmplot";
  const start = [[0, 0], [1, 2], [2, 1]];
  const end = [[1, 1], [2, 3], [4, 0]];
</script>

<Plot height={300} axes2d autoBounds>
  <Segments {start} {end} />
</Plot>
Options
Options
connectionsconnect()- Draw between other marks instead of from start and end: connect(a, b, {key}) draws a segment for each matched key and pair of adjacent endpoints.
dashboolean | number | [number, number]- Draw the line dashed: true (4 px dashes and gaps), a dash length (gaps as long), or [dash, gap], measured along the drawn path. In px.
curve"linear" | "step" | "step-before" | "step-after" | "link-horizontal" | "link-vertical" | "quadratic" | "cubic"- How each segment runs from start to end: straight, in steps, as a tree link, or as a Bézier curve through its control points. Default: "linear", or "cubic" when control points are given.
control1channel- Each segment's first control point for a quadratic or cubic curve: a column of positions or an N x 2 (N x 3) array. Without curve, control points make the segments cubic.
control2channel- Each segment's second control point for a cubic curve; left out of an automatic cubic, it is the segment's end.
cap"none" | "bar" | "arrow"- "bar": a bar across both ends; "arrow": an arrowhead at the true end, following the curve. Default:
"none". capSizenumber- The length of the bars cap="bar" draws. Default:
6px. headLengthnumber- The length of cap="arrow" heads, limited to the segment's length. Default:
10px. headWidthnumber- The width of cap="arrow" heads. Default:
8px.
Appearance
colorchannel- The line or text color: a CSS color, or a column mapped to colors. Default: the theme's (#3478c7 in the default theme).
widthchannel- The line width: a number, or a column mapped to widths. Default: the theme's (1 in the default theme). In px.
opacitychannel- The opacity, 0 to 1: a number, or a column (categories map through opacityScale). Default:
1.
Scales
colorScalescale- A scale for color that marks can share.
colormapstring | color[] | object- The colormap of a numeric fill or color: a name, a list of colors, or {colors, space, positions}. Default: the theme's (Viridis).
widthScalescale- A scale for width that marks can share, as sizeScale.
opacityScalescale- A categorical() scale from the opacity column's categories to opacities, 0 to 1.
Display
labelstring- The mark's name in the legend and the settings pane.
legendboolean- Whether the mark has a legend entry. Default:
true. visibleboolean- Whether the mark is drawn. Default:
true. domainsboolean- Whether the mark's data counts toward its axes' automatic domains; false leaves them to the other marks (a reference line, a decorative part). Default:
true. rows"auto"- "auto" draws one item when no channel reads a column (a line at a value, a label at a point), instead of one per row of the data; "@" view-state fields are not columns.
blend"normal" | "additive" | "multiply" | "screen" | "subtractive"- How the mark mixes with what is drawn under it; any mode but normal draws it transparent, and SVG and PDF exports draw additive and subtractive as an image. Default:
"normal". glownumber- How much the mark glows: its own color times glow blooms around it in the plot's presentation (0 does not glow); the Plot's bloom effect sets the bloom's strength and radius. SVG and PDF exports draw the whole plot as an image. Default:
0. shadeShadeSpec- A plugin's shade (registerPlugin): { kind, ...parameters }, as { kind: "hatch", spacing: 6 } (Python hm.shade("hatch", spacing=6)), recolors each fragment the mark draws; picking, tooltips, domains and legends are unchanged. SVG and PDF exports draw a shaded mark as an image.
optionsstring[]- The settings the settings pane shows for this mark, by name.
namestring- The mark's name in the settings pane, and the name facet.endpoint() and partition.endpoint() find it by.
Interaction
identityidentity- Whose rows these are for selections: an identity() shared by tables that show the same things. Default: its data's.
selectboolean | selection | object- Click to replace the selection; an exact repeat clears it. Shift/Meta/Ctrl-click toggles membership (whole series for Line, Area): true uses its data's selection, or give a selection(). input("root").set("id") writes an input instead: a click sets it to the clicked row's id (a drill-down's root), .set(literal(v)) to a constant, .reset() to its default, and a click on nothing restores its default (input("root", {default}), else a Select of that name's, else null); several marks may write one input.
hoverboolean | selection | object- Mark the row under the pointer as @hovered (a whole series for Line, Area), without fading the others: true uses its data's hover, or give a selection(). input("focus").set("series") writes an input instead: while the pointer is on a row the input shows its series (or .set(literal(v)), a constant), then its committed value again (a hover that would change this mark's own rows is an error).
tooltipboolean | field[] | object- Show the nearest row's values in a box by the pointer: true, a list of fields, or {fields, radius, content}. Default: the Plot's.
nearestboolean | selection | object- Mark the row a tooltip shows as @nearest, with or without the tooltip: under the pointer, else the nearest drawn row within radius pixels (a whole series for Line, Area): true, a selection(), or {selection, radius}. Default: the Plot's.
respondboolean | "selected" | "brushed" | "hovered" | "nearby" | "nearest" | selection | array- Which interaction states fade this mark's other rows to selectionOpacity; "hovered" fades them while hovering, "nearest" while a row is nearest. Default: the states it sets, except hover and nearest.
selectionOpacitynumber- The opacity of the rows outside the selection while one is active. Default:
0.25. onclick(event) => void- Called for click on this mark; row provenance is optional after transforms.
ondblclick(event) => void- Called for dblclick on this mark; row provenance is optional after transforms.
oncontextmenu(event) => void- Called for contextmenu on this mark; row provenance is optional after transforms.
onpointerenter(event) => void- Called for pointerenter on this mark; row provenance is optional after transforms.
onpointerleave(event) => void- Called for pointerleave on this mark; row provenance is optional after transforms.
onpointermove(event) => void- Called for pointermove on this mark; row provenance is optional after transforms.
onpointerdown(event) => void- Called for pointerdown on this mark; row provenance is optional after transforms.
onpointerup(event) => void- Called for pointerup on this mark; row provenance is optional after transforms.
onpointercancel(event) => void- Called for pointercancel on this mark; row provenance is optional after transforms.
onpointerover(event) => void- Called for pointerover on this mark; row provenance is optional after transforms.
onpointerout(event) => void- Called for pointerout on this mark; row provenance is optional after transforms.
onpointermissed(event) => void- Called for pointermissed on this mark; row provenance is optional after transforms.
enterEffectboolean | "fade" | object- How rows that arrive in a keyed update appear: "fade", or {effect, duration, easing}. animate()'s enter option is the value a channel starts from.
exitEffectboolean | "fade" | object- How rows that leave in a keyed update disappear, as enterEffect. animate()'s exit option is the value a channel ends at.
Animation
animationboolean- Animate changes to the mark's values. Default:
false. animationDurationnumber- How long an animated change takes. Default:
300ms. animationEasing"linear" | "quad-in" | "quad-out" | "quad-in-out" | "cubic-in" | "cubic-out" | "cubic-in-out" | "sine-in-out"- The animation's easing. Default:
"cubic-in-out".
Segment ends
startchannel- Where each segment starts (Segments, Arrows): a column of positions or an N x 2 (N x 3) array.
endchannel- Where each segment ends, as start.
Map paths
interpolation"great-circle" | "angular" | "cartesian"- How a path between two points runs on a map or a globe: along a great circle, straight in longitude and latitude, or straight in space. Default:
"great-circle".
Legend settings
legendFontSizenumbersetting- The size of the mark's legend text. Default: the theme's (14 in the default theme). In px.
legendFontFamilystringsetting- The font of the mark's legend text, a CSS font-family. Default: the plot's font.
legendTextColorcolorsetting- The color of the mark's legend text. Default:
"#40505d". legendTickFormatstringsetting- How a colorbar labels numbers: a d3-format string, or a %-pattern for dates. Default:
".3~g".
Color settings
quantizebooleansetting- Step a numeric fill or color into `levels` colors instead of a smooth gradient. Default:
false. levelsnumbersetting- How many colors quantize steps through. Default:
10.
Limits
maxElementsnumbersetting- The most rows the mark prepares on the GPU. Default:
250000.
The mark's own axes
xTransform"linear" | "log" | "sqrt" | "symlog"setting- This mark's own x transform, instead of its frame's. Default: its frame's.
xInvertbooleansetting- Reverse this mark's x direction. Default:
false. xbounds[number, number]setting- The x extent this mark maps, instead of its frame's domain (an image's or a grid's extent). Default: its frame's.
xrange[number, number]setting- Where this mark's x extent lands, in its frame's world units. Default: its frame's.
yTransform"linear" | "log" | "sqrt" | "symlog"setting- This mark's own y transform, instead of its frame's. Default: its frame's.
yInvertbooleansetting- Reverse this mark's y direction. Default:
false. ybounds[number, number]setting- The y extent this mark maps, instead of its frame's domain (an image's or a grid's extent). Default: its frame's.
yrange[number, number]setting- Where this mark's y extent lands, in its frame's world units. Default: its frame's.
zTransform"linear" | "log" | "sqrt" | "symlog"setting- This mark's own z transform, instead of its frame's. Default: its frame's.
zInvertbooleansetting- Reverse this mark's z direction. Default:
false. zbounds[number, number]setting- The z extent this mark maps, instead of its frame's domain (an image's or a grid's extent). Default: its frame's.
zrange[number, number]setting- Where this mark's z extent lands, in its frame's world units. Default: its frame's.
Shading
transparentbooleansetting- Draw the mark in the transparent pass, blended in depth order with other transparent marks. Default:
false.
Advanced renderer options
maxInstancesnumber | null- The most rows drawn; past it the rows are sampled (null draws them all), though SVG and PDF exports draw every row. Default:
null.
Usage
Each start/end pair is one observation. Independent segments do not infer neighboring rows. Curve controls may be supplied per segment; source identities survive subdivision. cap="bar" draws a bar capSize pixels long (6 by default) across each segment at both ends, as ErrorBars’ caps; a curved segment’s bars stand across its direction at its ends, and a segment cut at a horizon or seam has no bar at the cut.
cap="arrow" draws an arrowhead at the true end. headLength (10) and headWidth (8) are CSS pixels; the head follows a curve’s final segment. These settings also appear in the settings pane. Zooming keeps the head’s pixel size.
Connections
With connections={connect(a, b)} Segments draw one segment per matched key between the positions of two other marks; connect(a, b, c) draws a to b and b to c. See connect().