Points
A scatter plot's symbols, one per row.
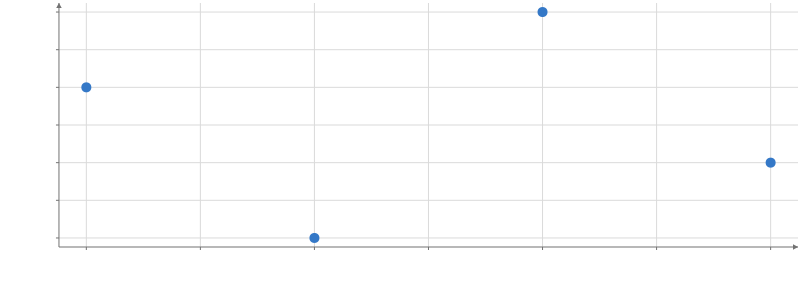 Static preview
; loading the interactive plot
<script>
  import { Plot, Points } from "hmplot";
  const data = { x: [1, 2, 3, 4], y: [3, 1, 4, 2] };
</script>

<Plot {data} height={300} axes2d>
  <Points x="x" y="y" />
</Plot>
Options
Options
xOffsetchannel- Moves each row along x in data units: on a categorical axis a band is one unit, so 0.25 is a quarter of the category's band (grouped bars, dodged points). A number or a column. dx moves by CSS pixels. Default:
0data. yOffsetchannel- Moves each row along y in data units: on a categorical axis a band is one unit (side-by-side horizontal bars). A number or a column. dy moves by CSS pixels. Default:
0data. dxchannel- Moves each point right, or left when negative: a number, or a column (Dodge writes one). Default:
0px. dychannel- Moves each point down, or up when negative: a number, or a column (Dodge writes one). Default:
0px.
Position
xchannel- The x position: a column, per-row values, or one value.
ychannel- The y position: a column, per-row values, or one value.
zchannel- The z position, in a 3D plot: a column, per-row values, or one value.
positionchannel- Positions as one column or an N x 2 (or N x 3) array, instead of x, y and z.
Appearance
fillchannel- The fill color: a CSS color, or a column of numbers or categories mapped to colors. "transparent" draws a hollow point, its outline alone (outlineColor, outlineWidth); colors are otherwise opaque (use opacity). Default: the theme's (#3478c7 in the default theme).
colorchannel- The line or text color: a CSS color, or a column mapped to colors.
sizechannel- Each point's diameter in CSS pixels (in x units with sizeUnits="data"): a number, or a column mapped through sizeScale (by default onto the automatic size range). Default:
6px. opacitychannel- The opacity, 0 to 1: a number, or a column (categories map through opacityScale). Default:
1. outlineColorchannel- The outline's color: a CSS color, or a column of categories mapped through outlineColorScale.
outlineOpacitychannel- Border opacity from 0 to 1: a number, numeric column, array or expression. Fades the border over the fill; mark opacity still applies to both. Missing values hide the border. Default:
1. outlineWidthchannel- The outline's width in CSS pixels, drawn inside the mark's edge (a point's at most its radius). Default:
0.
Scales
fillScalescale- The fill's scale, which marks can share: continuous({domain, colormap, transform}) for numbers, categorical({domain, range}) or ordinal() for categories.
colorScalescale- A scale for color that marks can share.
colormapstring | color[] | object- The colormap of a numeric fill or color: a name, a list of colors, or {colors, space, positions}. Default: the theme's (Viridis).
sizeScalescale- The size's scale, which marks can share: continuous({domain, range, transform}) for numbers (without a range, the automatic one), or categories with a numeric range.
outlineColorScalescale- A categorical() scale from the outlineColor column's categories to colors.
opacityScalescale- A categorical() scale from the opacity column's categories to opacities, 0 to 1.
Display
labelstring- The mark's name in the legend and the settings pane.
legendboolean- Whether the mark has a legend entry. Default:
true. visibleboolean- Whether the mark is drawn. Default:
true. domainsboolean- Whether the mark's data counts toward its axes' automatic domains; false leaves them to the other marks (a reference line, a decorative part). Default:
true. rows"auto"- "auto" draws one item when no channel reads a column (a line at a value, a label at a point), instead of one per row of the data; "@" view-state fields are not columns.
blend"normal" | "additive" | "multiply" | "screen" | "subtractive"- How the mark mixes with what is drawn under it; any mode but normal draws it transparent, and SVG and PDF exports draw additive and subtractive as an image. Default:
"normal". glownumber- How much the mark glows: its own color times glow blooms around it in the plot's presentation (0 does not glow); the Plot's bloom effect sets the bloom's strength and radius. SVG and PDF exports draw the whole plot as an image. Default:
0. shadeShadeSpec- A plugin's shade (registerPlugin): { kind, ...parameters }, as { kind: "hatch", spacing: 6 } (Python hm.shade("hatch", spacing=6)), recolors each fragment the mark draws; picking, tooltips, domains and legends are unchanged. SVG and PDF exports draw a shaded mark as an image.
optionsstring[]- The settings the settings pane shows for this mark, by name.
namestring- The mark's name in the settings pane, and the name facet.endpoint() and partition.endpoint() find it by.
Interaction
identityidentity- Whose rows these are for selections: an identity() shared by tables that show the same things. Default: its data's.
selectboolean | selection | object- Click to replace the selection; an exact repeat clears it. Shift/Meta/Ctrl-click toggles membership (whole series for Line, Area): true uses its data's selection, or give a selection(). input("root").set("id") writes an input instead: a click sets it to the clicked row's id (a drill-down's root), .set(literal(v)) to a constant, .reset() to its default, and a click on nothing restores its default (input("root", {default}), else a Select of that name's, else null); several marks may write one input.
hoverboolean | selection | object- Mark the row under the pointer as @hovered (a whole series for Line, Area), without fading the others: true uses its data's hover, or give a selection(). input("focus").set("series") writes an input instead: while the pointer is on a row the input shows its series (or .set(literal(v)), a constant), then its committed value again (a hover that would change this mark's own rows is an error).
tooltipboolean | field[] | object- Show the nearest row's values in a box by the pointer: true, a list of fields, or {fields, radius, content}. Default: the Plot's.
brushboolean | selection | object- Brush rows with Shift-drag (point marks; Line, Area brush whole series): true uses its data's brush, a selection() shares one, {selection, axis} picks the axes.
nearbyboolean | selection | object- Mark the rows near the pointer (point marks): true, a selection(), or {selection, radius, units, axis}.
nearestboolean | selection | object- Mark the row a tooltip shows as @nearest, with or without the tooltip: under the pointer, else the nearest drawn row within radius pixels (a whole series for Line, Area): true, a selection(), or {selection, radius}. Default: the Plot's.
respondboolean | "selected" | "brushed" | "hovered" | "nearby" | "nearest" | selection | array- Which interaction states fade this mark's other rows to selectionOpacity; "hovered" fades them while hovering, "nearest" while a row is nearest. Default: the states it sets, except hover and nearest.
selectionOpacitynumber- The opacity of the rows outside the selection while one is active. Default:
0.25. dragboolean | "x" | "y" | "z" | "xy" | "xz" | "yz" | "xyz"- Drag rows to move them (point marks): true along every numeric axis, or the axes to move along. Default:
false. onclick(event) => void- Called for click on this mark; row provenance is optional after transforms.
ondblclick(event) => void- Called for dblclick on this mark; row provenance is optional after transforms.
oncontextmenu(event) => void- Called for contextmenu on this mark; row provenance is optional after transforms.
onpointerenter(event) => void- Called for pointerenter on this mark; row provenance is optional after transforms.
onpointerleave(event) => void- Called for pointerleave on this mark; row provenance is optional after transforms.
onpointermove(event) => void- Called for pointermove on this mark; row provenance is optional after transforms.
onpointerdown(event) => void- Called for pointerdown on this mark; row provenance is optional after transforms.
onpointerup(event) => void- Called for pointerup on this mark; row provenance is optional after transforms.
onpointercancel(event) => void- Called for pointercancel on this mark; row provenance is optional after transforms.
onpointerover(event) => void- Called for pointerover on this mark; row provenance is optional after transforms.
onpointerout(event) => void- Called for pointerout on this mark; row provenance is optional after transforms.
onpointermissed(event) => void- Called for pointermissed on this mark; row provenance is optional after transforms.
ondrag(event) => void- Called while rows are dragged, each time they move. Python: on_event("drag").
ondragend(event) => void- Called when a drag ends; event.cancelled when Escape put the rows back. Python: on_event("dragend").
enterEffectboolean | "fade" | object- How rows that arrive in a keyed update appear: "fade", or {effect, duration, easing}. animate()'s enter option is the value a channel starts from.
exitEffectboolean | "fade" | object- How rows that leave in a keyed update disappear, as enterEffect. animate()'s exit option is the value a channel ends at.
Animation
animationboolean- Animate changes to the mark's values. Default:
false. animationDurationnumber- How long an animated change takes. Default:
300ms. animationEasing"linear" | "quad-in" | "quad-out" | "quad-in-out" | "cubic-in" | "cubic-out" | "cubic-in-out" | "sine-in-out"- The animation's easing. Default:
"cubic-in-out".
Symbol rotation
rotationnumber- The symbol's rotation. Default:
0degrees.
Symbol
shapestring | column | string[]- The point symbol: a shape name, a column of categories mapped to shapes, or one name per row. Default:
"circle". shapeScalescale- A categorical() scale from the shape column's categories to shape names.
Size units
sizeUnits"px" | "data"- What size measures: CSS pixels whatever the zoom, or units of the x axis, so zooming scales the points. Default:
"px".
Legend settings
legendFontSizenumbersetting- The size of the mark's legend text. Default: the theme's (14 in the default theme). In px.
legendFontFamilystringsetting- The font of the mark's legend text, a CSS font-family. Default: the plot's font.
legendTextColorcolorsetting- The color of the mark's legend text. Default:
"#40505d". legendTickFormatstringsetting- How a colorbar labels numbers: a d3-format string, or a %-pattern for dates. Default:
".3~g".
Color settings
quantizebooleansetting- Step a numeric fill or color into `levels` colors instead of a smooth gradient. Default:
false. levelsnumbersetting- How many colors quantize steps through. Default:
10.
Limits
maxElementsnumbersetting- The most rows the mark prepares on the GPU. Default:
250000.
The mark's own axes
xTransform"linear" | "log" | "sqrt" | "symlog"setting- This mark's own x transform, instead of its frame's. Default: its frame's.
xInvertbooleansetting- Reverse this mark's x direction. Default:
false. xbounds[number, number]setting- The x extent this mark maps, instead of its frame's domain (an image's or a grid's extent). Default: its frame's.
xrange[number, number]setting- Where this mark's x extent lands, in its frame's world units. Default: its frame's.
yTransform"linear" | "log" | "sqrt" | "symlog"setting- This mark's own y transform, instead of its frame's. Default: its frame's.
yInvertbooleansetting- Reverse this mark's y direction. Default:
false. ybounds[number, number]setting- The y extent this mark maps, instead of its frame's domain (an image's or a grid's extent). Default: its frame's.
yrange[number, number]setting- Where this mark's y extent lands, in its frame's world units. Default: its frame's.
zTransform"linear" | "log" | "sqrt" | "symlog"setting- This mark's own z transform, instead of its frame's. Default: its frame's.
zInvertbooleansetting- Reverse this mark's z direction. Default:
false. zbounds[number, number]setting- The z extent this mark maps, instead of its frame's domain (an image's or a grid's extent). Default: its frame's.
zrange[number, number]setting- Where this mark's z extent lands, in its frame's world units. Default: its frame's.
Geometry
detailnumbersetting- How finely a point's or a surface's geometry is divided (sphere segments, grid cells).
Shading
litbooleansetting- Shade the mark with the plot's lights. Default:
false. transparentbooleansetting- Draw the mark in the transparent pass, blended in depth order with other transparent marks. Default:
false.
Advanced renderer options
depthWriteboolean- Write visible point fragments to the depth buffer with normal blending; false leaves depth testing and nearest-point picking unchanged. Other blend modes disable depth writes. Default:
true. maxInstancesnumber | null- The most rows drawn; past it the rows are sampled (null draws them all), though SVG and PDF exports draw every row. Default:
null.
Usage
size is the point’s diameter in CSS pixels, a literal one (the default is 6) as a column mapped through sizeScale’s range is; sizeUnits="data" makes it a width in x units. position is an alternative to x/y/z. shape is a symbol name for every point, a column mapped to symbols (shapeScale sets which ones), or one shape name per row; a column wins over a shape name spelled the same, so use literal(“circle”) to force the name. Symbol sizes remain stable during zoom. fill="transparent" draws a hollow point, its outline alone (outlineColor, outlineWidth), over whatever is behind it: a ring around a highlighted point. A color with an alpha is an error (colors are drawn opaque): use opacity for see-through points.
depthWrite (depth_write in Python) defaults to true with normal blending. Set it to false to draw points without updating the depth buffer: later points can cover earlier, nearer points in a 3D view. Depth testing against other objects and nearest-point picking remain enabled. Additive, screen and other blend modes already disable depth writes. Flat 2D plots retain their usual declaration order.
Python display shortcut
An unparented Python mark with data= can be the output of a notebook cell. Display creates one implicit Plot with the ordinary defaults. Use an explicit Plot when you need multiple marks or camera settings.
hm.Points(data=observations, x="length", y="width")