Treemap
A hierarchy drawn as nested rectangles, each leaf's area set by its value.
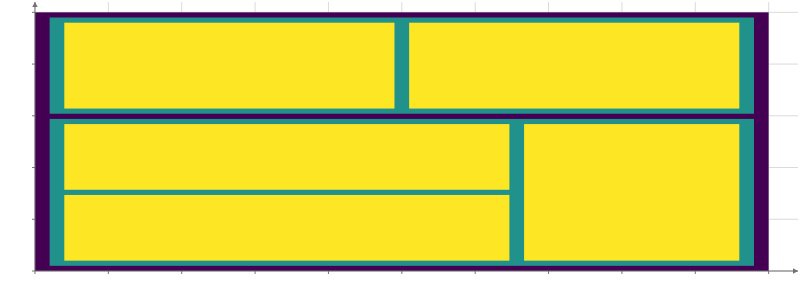
Static preview; loading the interactive plot
<script>
  import { Plot, Treemap, Nodes, Rect, GraphData } from "hmplot";
  const data = {
    source: ["root", "root", "a", "a", "a", "b", "b"],
    target: ["a", "b", "a1", "a2", "a3", "b1", "b2"],
  };
</script>

<Plot {data} height={300}>
  <GraphData source="source" target="target"
    ><Treemap root="root" padding={0.02}>
      <Nodes><Rect x0="x0" x1="x1" y0="y0" y1="y1" fill="depth" /></Nodes>
    </Treemap></GraphData
  >
</Plot>
Usage
Treemap uses d3-hierarchy to subdivide one connected, directed hierarchy. Supply the edges (and nodes, or let it infer them) and endpoint mapping through GraphData; set root on Treemap. value evaluates on node columns; leaf values determine area and default to 1. width and height default to 1. padding, paddingInner, and paddingOuter control gaps. tile selects squarify (default), resquarify, binary, slice, dice, or sliceDice.
Inside <Nodes>, x0, x1, y0, and y1 give rectangles; x, y, and position give centers. parent, depth, degree, and node attributes are also available. <Edges> retains source rows and exposes center-to-center start and end.
Drilling down
root may be any node, not only the hierarchy’s: the layout divides that node’s subtree to fill the whole area, and the other nodes stay rows of the nodes table, hidden, so marks draw only the subtree. depth counts from root (0), and levels={1} shows its children only (root itself is then left out, as its rectangle is the whole area). Each node’s total is its summed value, for labels and lists; parent is its parent’s ID, for an Up control. With const root = input("root", { default: "all" }) and root={root}, a click on a rectangle can set the input: select={root.set("id")} on the Rect writes the clicked node’s ID, a click on nothing restores the default, a Button with set={root.reset()} goes back to the top, and a Select named root shows and edits the same value. A node table may not have a column named total.
<script>
  const root = input("root", { default: "all" });
</script>

<InputContext>
  <Select name="root" options={["all", ...divisions]} />
  <Button label="Top" set={root.reset()} />
  <Plot>
    <GraphData {nodes} {edges} source="parent" target="id">
      <Treemap root={root} value="revenue" levels={1} padding={0.004}>
        <Nodes bind:this={shown}>
          <Rect x0="x0" x1="x1" y0="y0" y1="y1" fill="division" select={root.set("id")} />
          <Text x="x" y="y" text="id" />
        </Nodes>
      </Treemap>
    </GraphData>
  </Plot>
</InputContext>
root = hm.input("root", default="all")
with hm.Scene() as scene:
hm.Select(name="root", options=["all", *divisions])
hm.Button(label="Top", set=root.reset())
with hm.Plot():
with hm.GraphData(nodes=nodes, edges=edges, source="parent", target="id"):
with hm.Treemap(root=root, value="revenue", levels=1):
with hm.Nodes():
hm.Rect(x0="x0", x1="x1", y0="y0", y1="y1", fill="division", select=root.set("id"))await shown.read({ columns: ["id", "total"] }) gives the shown nodes for a breadcrumb or a list, or put a TableView inside the Nodes, after a Sort for a top ten.