Delaunay
The Delaunay triangulation of points, as edges for Segments.
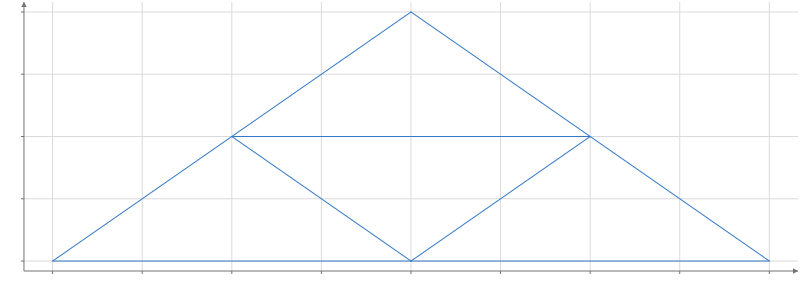
Static preview; loading the interactive plot
<script>
  import { Plot, Delaunay, Segments } from "hmplot";
  const data = { x: [0, 2, 4, 1, 3, 2], y: [0, 0, 0, 2, 2, 4] };
</script>

<Plot {data} height={300} axes2d>
  <Delaunay x="x" y="y">
    <Segments start="start" end="end" />
  </Delaunay>
</Plot>
Usage
Delaunay makes the triangulation’s edges, a row each: start and end for Segments, and source and target, the two points’ rows.