Pack
A hierarchy drawn as nested circles, each leaf's area set by its value.
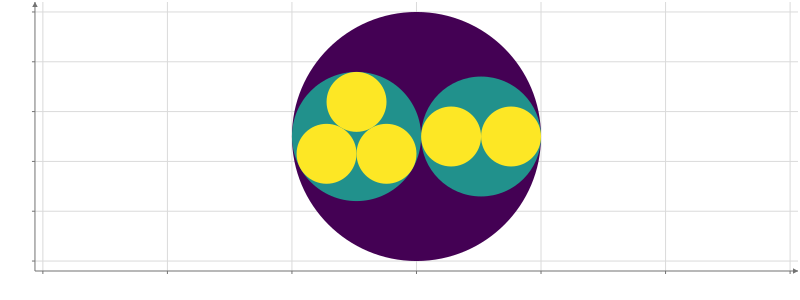
Static preview; loading the interactive plot
<script>
  import { Plot, Pack, Nodes, Points, multiply, GraphData } from "hmplot";
  const data = {
    source: ["root", "root", "a", "a", "a", "b", "b"],
    target: ["a", "b", "a1", "a2", "a3", "b1", "b2"],
  };
</script>

<Plot {data} height={300} aspect="equal">
  <GraphData source="source" target="target"
    ><Pack root="root">
      <Nodes
        ><Points
          position="position"
          size={multiply("r", 2)}
          sizeUnits="data"
          fill="depth"
        /></Nodes
      >
    </Pack></GraphData
  >
</Plot>
Usage
Pack uses d3-hierarchy to place one connected, directed hierarchy in nested circles. Supply the edges (and nodes, or let it infer them) and endpoint mapping through GraphData; set root on Pack. value evaluates on node columns; leaf values determine area and default to 1. width and height default to 1, and padding separates circles.
Inside <Nodes>, use x, y, position, and r to draw circles: Points with size={multiply("r", 2)} and sizeUnits="data" in a Plot with aspect="equal", so a data unit is as long on y as on x and each circle stays round and inside its parent (the automatic domain holds every whole circle). x0, x1, y0, and y1 enclose each circle. parent, depth, degree, and node attributes are also available. <Edges> retains source rows and exposes center-to-center start and end.
root may be any node, and levels shows that many levels below it, as on Treemap: a drill-down. Each node’s total is its summed value.