Sample
Keeps a random subset of the rows, a number or a fraction of them, in their original order or shuffled.
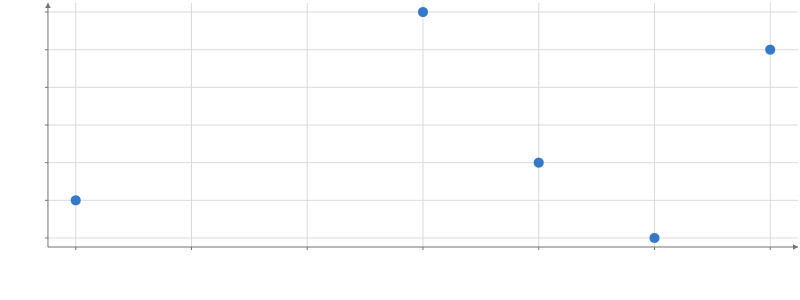
Static preview; loading the interactive plot
<script>
  import { Plot, Sample, Points } from "hmplot";
  const data = {
    x: [1, 2, 3, 4, 5, 6, 7, 8, 9, 10],
    y: [4, 7, 2, 9, 5, 3, 8, 6, 1, 10],
  };
</script>

<Plot {data} height={300} axes2d>
  <Sample size={5}>
    <Points x="x" y="y" />
  </Sample>
</Plot>
Usage
Retains selected rows in original order and preserves source identities. Specify size or proportion. Default seed is 42. With order="random" the kept rows come in the seed’s random order instead, and without a size or proportion every row is kept: <Sample order="random"> (Python hm.Sample(order="random")) shuffles the table, as the removed Shuffle did. This changes the data scope; mark-level rendering sampling is a separate performance setting.
To let the viewer change a setting, read an input in it: size={input("size")} (Python size=hm.input.size), where size is a Slider.