Named data & categories
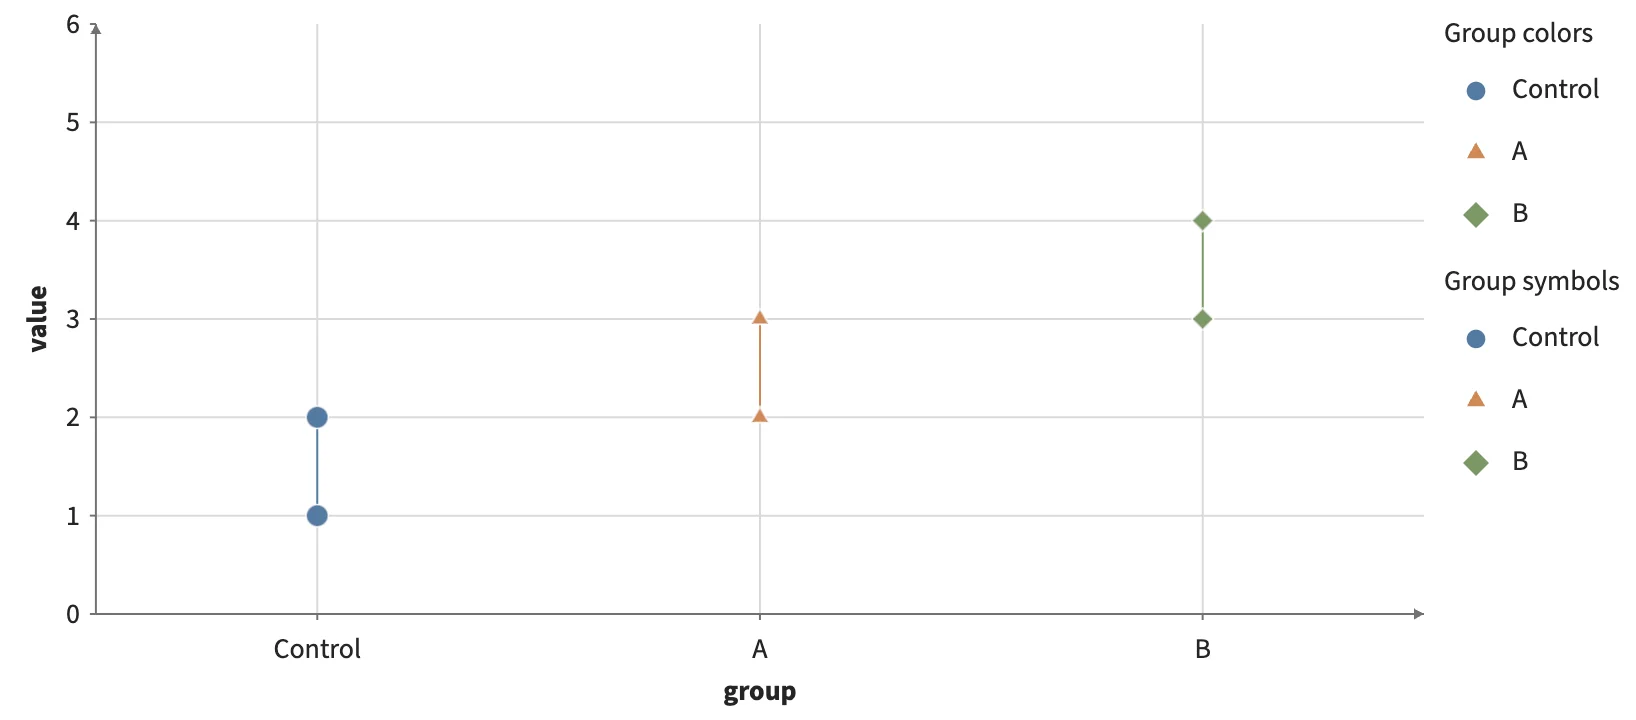
Named columns, shared categorical colors and symbols, categorical axes, and GPU dictionary columns.
Static preview; loading the interactive plot
<Plot x={{ scale: categorical({domain: ['Control', 'A', 'B']}) }}>
  <Data value={observations}>
    <Points x="group" y="value" fill="group" />
  </Data>
</Plot>