HMPlot

Interpolate

Fills a regular grid from scattered samples, for a heatmap, contours or a smooth line.
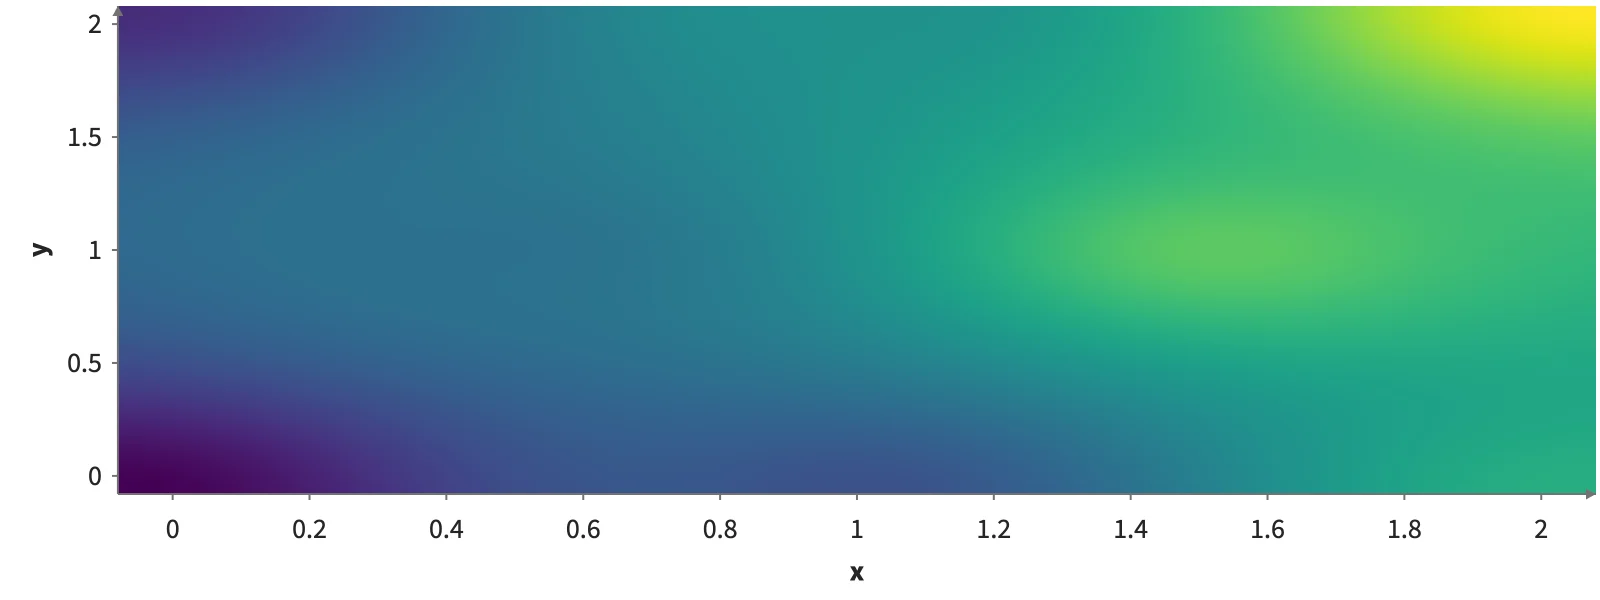
Heatmap of temperature over x and y. x from -0.1 to 2.1, y from -0.1 to 2.1. 16,384 rows.

Static preview; loading the interactive plot

<script>
  import { Plot, Interpolate, Heatmap } from "hmplot";
  const data = {
    x: [0, 1, 2, 0, 1, 2, 0.5, 1.5],
    y: [0, 0, 0, 2, 2, 2, 1, 1],
    temperature: [10, 12, 15, 11, 14, 18, 13, 16],
  };
</script>

<Plot {data} height={300} axes2d>
  <Interpolate x="x" y="y" values={["temperature"]}>
    <Heatmap fill="temperature" />
  </Interpolate>
</Plot>

Options

namestring
Names the transform, so a Facet's getTransform(name) reaches its copy in every cell.
xcolumn
The samples' x positions; the output's x column holds the grid's.
ycolumn
The samples' y positions, for a 2D grid (the output's y column); without it the grid is 1D.
valuescolumn[]
The columns to interpolate onto the grid, each output under its own name; categorical ones take the nearest sample's value.
resolutionnumber | [number, number] | expression
How many grid points: a number, or [nx, ny] in 2D. Default: 256 in 1D, [128, 128] in 2D.
method"auto" | "linear" | "bilinear" | "idw" | "nearest"
"linear" (1D), "bilinear" (2D samples on a complete rectangular grid), "idw" (inverse-distance weighting of nearby samples) or "nearest"; "auto" picks linear in 1D, bilinear for a complete grid and idw otherwise. Default: "auto".
bounds{x, y}
The grid's extent, as {x: [min, max], y: [min, max]}. Default: the samples' extent. In data units.

Usage

Outputs coordinates and requested value columns as a grid table (y then x; see Data, “Grid tables”), its 2-D cells tiling the bounds. auto uses linear interpolation in 1D, bilinear for complete rectangular data, and local IDW for scattered 2D samples. Categories always use nearest neighbors. Numeric columns share interpolation geometry.

To let the viewer change a setting, read an input in it: resolution={input("resolution")} (Python resolution=hm.input.resolution), where resolution is a Slider.

Related examples

Bilinear grid