HMPlot

Summary

An estimate per group, the mean or median, with an interval around it: the numbers behind error bars.
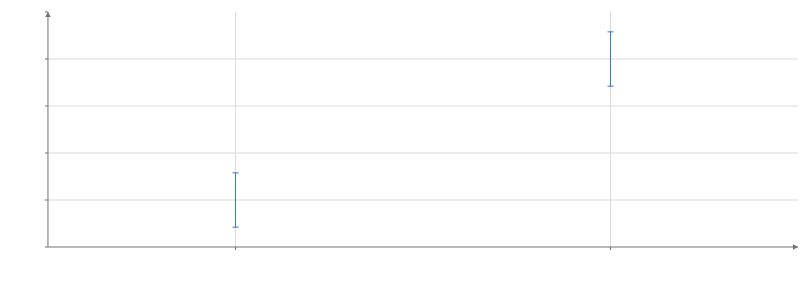
Error bars of value against group. x: a, b, y from 1 to 6. 2 error bars.

Static preview; loading the interactive plot

<script>
  import { Plot } from "hmplot";
import { Summary } from "hmplot/stats";
import { ErrorBars } from "hmplot/charts";
  const data = { group: ["a", "a", "a", "b", "b", "b"], value: [1, 2, 3, 4, 6, 5] };
</script>

<Plot {data} height={300} axes2d>
  <Summary field="value" by="group" interval="standard-error">
    <ErrorBars x="group" y="estimate" lower="lower" upper="upper" />
  </Summary>
</Plot>

Options

namestring
Names the transform, so a Facet's getTransform(name) reaches its copy in every cell.
fieldcolumn
The numeric column summarized; the output also has its `count`, `standardDeviation` and `standardError`.
bycolumn | column[]
The columns that group the rows: an output row per group, with its keys (one row without it).
estimate"mean" | "median"
What the `estimate` column holds: each group's mean or median. Default: "mean".
interval"none" | "deviation" | "standard-error" | "normal" | "bootstrap"
The `lower` and `upper` columns: one standard deviation or standard error either side of the mean, a normal confidence interval, or a bootstrap one (missing for "none"). Only a bootstrap takes the median. Default: "none".
confidencenumber
The confidence level of a normal or bootstrap interval, between 0 and 1. Default: 0.95.
samplesnumber
How many resamples a bootstrap interval draws. Default: 1000.
seednumber
The bootstrap's random seed, an integer: the same seed gives the same interval. Default: 42.
as{estimate, lower, upper, count, standardDeviation, standardError}
New names for the output columns.

Usage

Outputs estimate, lower, upper, count, standardDeviation, and standardError. Default estimate is mean and interval is none. Analytic intervals require mean; bootstrap supports mean or median with 1,000 replicates and seed 42 by default. A singleton has no defined sample variability.

To let the viewer change a setting, read an input in it: interval={input("interval")} (Python interval=hm.input.interval), where interval is a Select of interval names.

Related examples

Quantiles and group summaries