Panels
Stacks Plots over one shared x: one domain, panned and zoomed together, its axis drawn once under the stack.
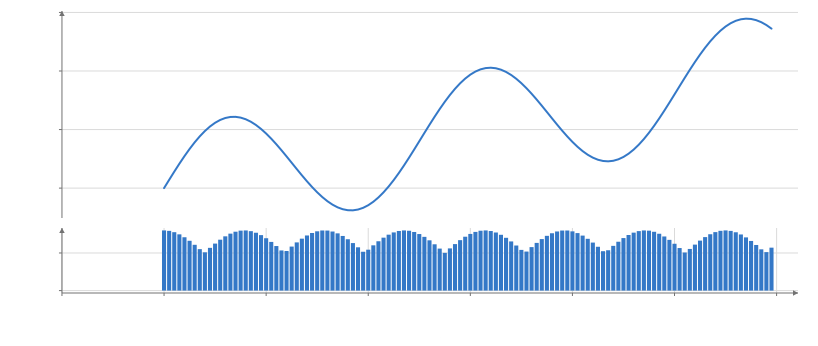
Static preview; loading the interactive plot
<script>
  import { Data, Panels, Plot, Line } from "hmplot";
  import { Bar } from "hmplot/charts";
  const days = Array.from({ length: 120 }, (_, d) => d);
  const data = { day: days, price: days.map((d) => 100 + 10 * Math.sin(d / 8) + d / 6), volume: days.map((d) => 50 + 30 * Math.abs(Math.cos(d / 5))) };
</script>

<!-- Two Plots over one x: zooming or panning either moves both; the axis is drawn once. -->
<Data value={data}>
  <Panels x={{ label: "Day" }}>
    <Plot height={220} y={{ label: "Price" }}><Line x="day" y="price" /></Plot>
    <Plot height={120} y={{ label: "Volume" }}><Bar x="day" y="volume" orientation="vertical" /></Plot>
  </Panels>
</Data>
Usage
Panels stacks Plots over one shared x, as matplotlib’s sharex does: its Plots show one x domain (the union of their data, or the domain given in x), pan and zoom together along x, and line up their plot areas, so the panels’ data share one time line however wide each one’s y labels are. Only the last Plot draws the x axis and its title; x holds that axis’s settings (label, format, domain, …), under each Plot’s own x. Each Plot keeps its own y axis, height, title and marks.
with hm.Data(prices):
    with hm.Panels(x={"label": "Trading day"}):
        with hm.Plot(height=240, y={"label": "Price"}):
            hm.Line(x="day", y="price")
        with hm.Plot(height=140, y={"label": "Volume"}):
            hm.charts.Bar(x="day", y="volume", orientation="vertical")
A rule at the same x in each panel (RuleX) marks one moment across them. Use Panels rather than separate Plots in a Column with LinkViews: those link navigation but repeat the axis and leave the plot areas to their own gutters. For a brush on an overview strip that zooms a chart, use FocusContext.