Sort
Orders the rows by one or more columns, so a line connects them in that order.
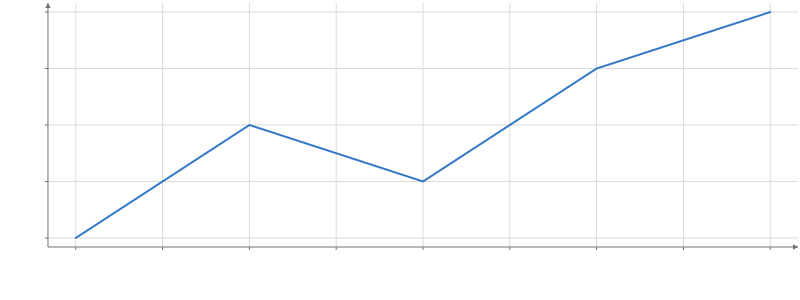
Static preview; loading the interactive plot
<script>
  import { Plot, Sort, Line } from "hmplot";
  const data = { x: [3, 1, 4, 2, 5], y: [2, 1, 4, 3, 5] };
</script>

<Plot {data} height={300} axes2d>
  <Sort by="x">
    <Line x="x" y="y" />
  </Sort>
</Plot>
Usage
Retains all columns and original picking identities. by accepts one field or an ordered list. Default order is asc and missing values sort last. Lines follow the resulting order; no mark sorts its input implicitly.
To let the viewer change a setting, read an input in it: order={input("order")} (Python order=hm.input.order), where order is a Select of "asc" and "desc".