LinkViews
Makes 2D plots pan and zoom together, over one shared domain.
Python only. Svelte pages lay this out with HTML and CSS.
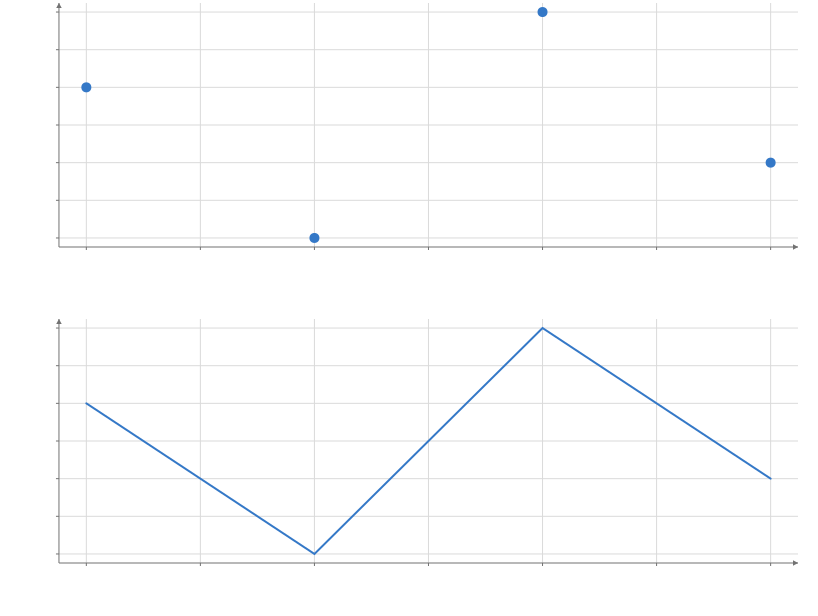
Static preview; loading the interactive plot
import hmplot as hm

data = {"x": [1, 2, 3, 4], "y": [3, 1, 4, 2]}
with hm.Scene() as scene:
    with hm.Plot(data=data, height=300, axes2d=True) as top:
        hm.Points(x="x", y="y")
    with hm.Plot(data=data, height=300, axes2d=True) as bottom:
        hm.Line(x="x", y="y")
    hm.LinkViews(top, bottom)
scene
Usage
Pass the Plot handles positionally: hm.LinkViews(first, second, axes=‘x’). Links compatible 2D dimensions with feedback suppression; 3D cameras remain independent.
The linked axes share one domain: the union of the plots’ domains (each one’s data, or its
explicit domain), so a value lines up in every plot and panning or zooming one moves the others
over the same range. Stacked panels whose data end at different dates, or whose labels pad their
ends differently, still align. A plot with an explicit domain keeps it, so it lines up with the
others only where its domain is theirs; a plot whose marks draw nothing takes the others’
domain. A plot can be in several LinkViews (one on x, another on y): each shares the domains of its own plots, as it links their views. scales="free" keeps each plot’s own domain.
A domain can be dates: x={"domain": [datetime.date(2024, 1, 1), datetime.date(2024, 3, 1)]} (or datetime64) draws a time axis over those days.