Filter
Keeps the rows that meet a condition, or the selected or brushed rows.
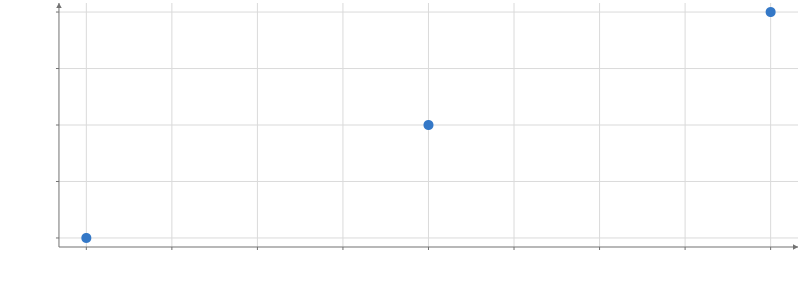
Static preview; loading the interactive plot
<script>
  import { Plot, Filter, Points, col, greater } from "hmplot";
  const data = { x: [1, 2, 3, 4, 5, 6], y: [3, 1, 4, 1, 5, 2] };
</script>

<Plot {data} height={300} axes2d>
  <Filter where={greater(col.y, 2)}>
    <Points x="x" y="y" />
  </Filter>
</Plot>
Usage
Retains source columns and observation identities in their original order. Supports eq, ne, lt, lte, gt, gte, in, and finite, as well as selection resources and virtual fields. Filtering reconnects retained line rows; category hiding instead leaves breaks.
where also takes an expression with one value per row, which may use reductions: where={greater("x", mean("x"))} keeps the rows above the mean, and where={logical_and(view.brushed, greater("x", mean("x")))} keeps the brushed ones among them and re-runs as the brush changes. A condition that is a single value (a bare reduction) is an error.
To let the viewer change a setting, read an input in it: where={greater(col("x"), input("threshold"))} (Python where=hm.col.x > hm.input.threshold), where threshold is a Slider.