DateTimeInput
A date and time edited in a chosen time zone, held as a Date or null.
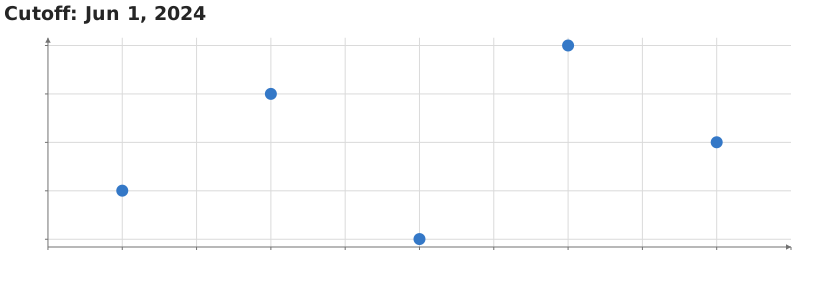
Static preview; loading the interactive plot
<script>
  import { DateTimeInput, InputContext, Plot, Points, input } from "hmplot";
  const data = { x: [1, 3, 5, 7, 9], y: [2, 4, 1, 5, 3] };
</script>

<InputContext>
  <DateTimeInput name="cutoff" value={new Date("2024-06-01T12:00:00Z")} timezone="UTC" />
  <Plot {data} height={300} axes2d title={"Cutoff: {$cutoff}"}>
    <Points x="x" y="y" size={12}  />
  </Plot>
</InputContext>
Usage
Edit a date and time in timezone (UTC by default). The value is a JavaScript Date or Python datetime, representing an instant; changing the editing zone does not change that instant. Use min and max to bound the date, and step in milliseconds to set its precision (default: one minute). Clearing the input publishes null in JavaScript or None in Python.
Daylight-saving transitions can make a local time nonexistent or ambiguous. Such edits show an error and keep the last valid value; choose an unambiguous time, or edit in UTC. Timezone-aware Python datetimes make the intended instant explicit.
Place the control beside the plot in an InputContext (JavaScript) or Scene (Python). Readers use input("name") or hm.input.name. The name must be unique in that context.
Static image exports show the plot at the current values and omit the controls.