Normalize
Rescales a column to z-scores, to 0 to 1, or relative to its sum, first value or maximum, over all rows or per group.
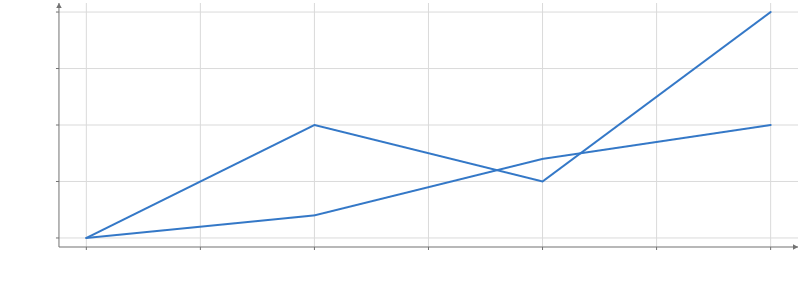
Static preview; loading the interactive plot
<script>
  import { Plot, Line } from "hmplot";
import { Normalize } from "hmplot/stats";
  const data = {
    day: [1, 2, 3, 4, 1, 2, 3, 4],
    stock: ["A", "A", "A", "A", "B", "B", "B", "B"],
    price: [10, 12, 11, 14, 50, 52, 57, 60],
  };
</script>

<Plot {data} height={300} axes2d>
  <Normalize field="price" method="first" by="stock">
    <Line x="day" y="normalized" series="stock" />
  </Normalize>
</Plot>
Usage
Retains source columns and adds the as column. Methods are deviation (default), extent, sum, first, and max. by sets groups. Constant-feature deviation normalization produces zero.
To let the viewer change a setting, read an input in it: method={input("method")} (Python method=hm.input.method), where method is a Select of methods.
This is a template over Calculate, not a separate normalization kernel. The deviation method expands to (field - mean(field)) / where(std(field) > 0, std(field), 1); extent uses the minimum and maximum, and sum, first, and max divide by that reduction.
Reductions ignore hidden and nonfinite values. With by, the runner prepares the grouping keys
once for the expression, including numeric keys. The caller’s children read the resulting column.