Slider
A number, date or two-endpoint interval the viewer drags between min and max, read by name.
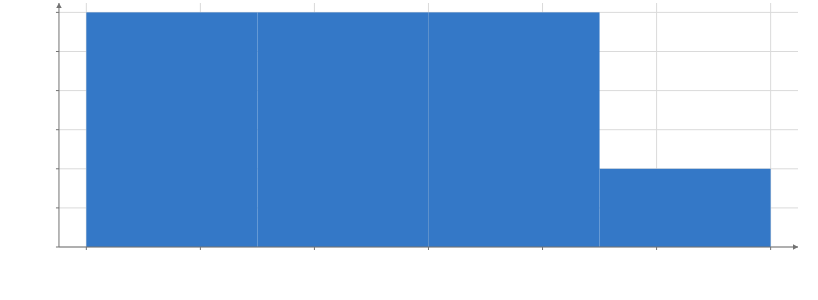
Static preview; loading the interactive plot
<script>
  import { InputContext, Plot, Rect, Slider, input } from "hmplot";
import { Bin } from "hmplot/stats";
  const data = { x: [1, 2, 2, 3, 3, 3, 4, 4, 5, 7] };
</script>

<InputContext>
  <Slider name="bins" min={1} max={10} step={1} value={4} />
  <Plot {data} height={300} axes2d>
    <Bin x="x" bins={input("bins")}>
      <Rect x0="x0" x1="x1" y0={0} y1="count" />
    </Bin>
  </Plot>
</InputContext>
Usage
Use a scalar value for one thumb or [lower, upper] for two thumbs selecting an interval.
Endpoints are sorted and clamped to min and max; either numbers or Dates work, including
calendar steps. Both thumbs support keyboard arrows and cannot cross. This replaces RangeSlider.
In Svelte, bind the interval with bind:value; in Python, read it with hm.input.name,
for example as a plot domain.
An input sends its value up to the nearest input context (an InputContext, a Python Scene, or a Template instance), and everything in that context reads it by name: input("name") in JavaScript, hm.input.name in Python, or the string "$name" where a string names a column. A read is replaced by the value before its reader sees it, so moving an input re-runs its readers once, and the change animates like any other data change. Inputs go beside Plots (in a Row or Column), not inside them.