Checkbox
True or false, set by the viewer and read by name.
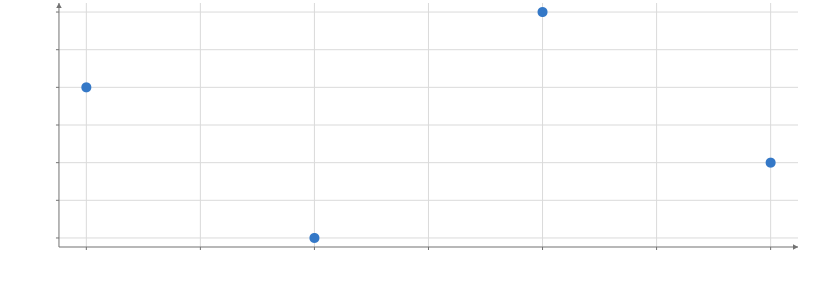
Static preview; loading the interactive plot
<script>
  import { Checkbox, InputContext, Line, Plot, Points, input } from "hmplot";
  const data = { x: [1, 2, 3, 4], y: [3, 1, 4, 2] };
</script>

<InputContext>
  <Checkbox name="line" />
  <Plot {data} height={300} axes2d>
    <Points x="x" y="y" />
    <Line x="x" y="y" visible={input("line")} />
  </Plot>
</InputContext>
Usage
An input sends its value up to the nearest input context (an InputContext, a Python Scene, or a Template instance), and everything in that context reads it by name: input("name") in JavaScript, hm.input.name in Python, or the string "$name" where a string names a column. A read is replaced by the value before its reader sees it, so moving an input re-runs its readers once, and the change animates like any other data change. Inputs go beside Plots (in a Row or Column), not inside them.