Legend
A key to a plot's marks, or to the colors, shapes or sizes one channel encodes.
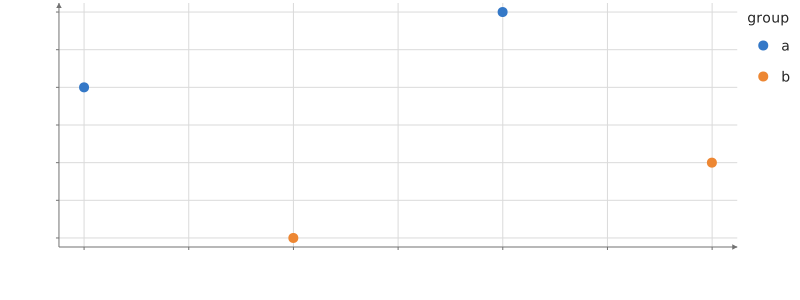
Static preview; loading the interactive plot
<script>
  import { Legend, Plot, Points } from "hmplot";
  const data = { x: [1, 2, 3, 4], y: [3, 1, 4, 2], group: ["a", "b", "a", "b"] };
</script>

<Plot {data} height={300} axes2d>
  <Points x="x" y="y" fill="group" />
  <Legend channel="fill" />
</Plot>
Usage
Without channel, explain what the marks encode: one guide for each channel they map from data (a Line colored by city lists the cities in their colors), a column shown once per mark, then the labeled marks, one entry per authored mark: a mark repeated in every Facet cell is one entry, and toggling it hides it in every cell. A Plot’s or Facet’s automatic legend (true or {position}) shows the same; with no legend, a Plot shows only the colors mapped from a category column, and the automatic legend leaves out a channel an explicit Legend explains. With channel, describe fill, color, shape, outlineColor, size, width, or opacity. Category columns draw swatches, merged across channels that share the column (fill and shape by one column draw colored symbols). Numeric columns draw a colorbar for fill and color, and a ramp of sample glyphs for size, width, and opacity. Given a Plot, Facet, or list of marks, marks sharing one scale resource share one guide.
There is one legend per outermost Plot or Facet: a Legend written inside a Facet cell is drawn once around the grid. Embedded guides reserve layout space and appear in the Plot’s exports; external guides occupy document flow. Colorbars export as SVG gradients. Activation toggles visibility; Shift isolates entries.
Size, width and opacity ramps measure their formatted labels when laying out their sample glyphs, so long values remain separate in horizontal legends and fit in vertical legends.