BandX
A vertical shaded reference interval spanning the visible frame.
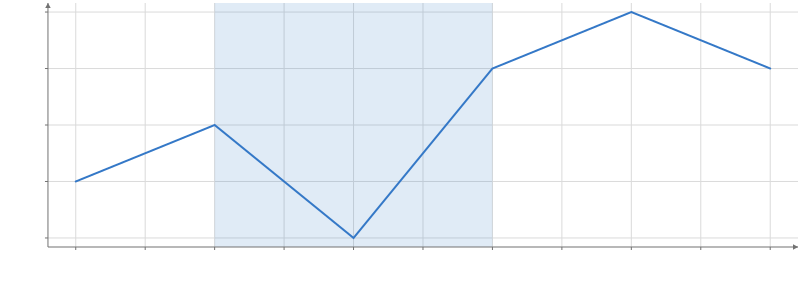 Static preview
; loading the interactive plot
<script>
  import { Plot, Line } from "hmplot";
  import { BandX } from "hmplot/charts";
  const data = { x: [1, 2, 3, 4, 5, 6], y: [3, 4, 2, 5, 6, 5] };
</script>

<Plot {data} height={300} axes2d>
  <BandX x0={2} x1={4} fill="#3478c7" />
  <Line x="x" y="y" />
</Plot>
Options
Options
x0channel- The interval's starting x coordinate: a number, date or column.
x1channel- The interval's ending x coordinate: a number, date or column.
Appearance
fillchannel- The fill color: a CSS color, or a column of numbers or categories mapped to colors.
opacitynumber- The band's opacity, 0 to 1. Default:
0.15. outlineColorchannel- The outline's color: a CSS color, or a column of categories mapped through outlineColorScale.
outlineOpacitychannel- Border opacity from 0 to 1: a number, numeric column, array or expression. Fades the border over the fill; mark opacity still applies to both. Missing values hide the border. Default:
1. outlineWidthchannel- The outline's width in CSS pixels, drawn inside the mark's edge (a point's at most its radius). Default:
0.
Scales
fillScalescale- The fill's scale, which marks can share: continuous({domain, colormap, transform}) for numbers, categorical({domain, range}) or ordinal() for categories.
outlineColorScalescale- A categorical() scale from the outlineColor column's categories to colors.
opacityScalescale- A categorical() scale from the opacity column's categories to opacities, 0 to 1.
Display
labelstring- The mark's name in the legend and the settings pane.
legendboolean- Include the band in a legend. Default:
false. visibleboolean- Whether the mark is drawn. Default:
true. blend"normal" | "additive" | "multiply" | "screen" | "subtractive"- How the mark mixes with what is drawn under it; any mode but normal draws it transparent, and SVG and PDF exports draw additive and subtractive as an image. Default:
"normal". glownumber- How much the mark glows: its own color times glow blooms around it in the plot's presentation (0 does not glow); the Plot's bloom effect sets the bloom's strength and radius. SVG and PDF exports draw the whole plot as an image. Default:
0. shadeShadeSpec- A plugin's shade (registerPlugin): { kind, ...parameters }, as { kind: "hatch", spacing: 6 } (Python hm.shade("hatch", spacing=6)), recolors each fragment the mark draws; picking, tooltips, domains and legends are unchanged. SVG and PDF exports draw a shaded mark as an image.
optionsstring[]- The settings the settings pane shows for this mark, by name.
namestring- The mark's name in the settings pane, and the name facet.endpoint() and partition.endpoint() find it by.
Interaction
identityidentity- Whose rows these are for selections: an identity() shared by tables that show the same things. Default: its data's.
selectboolean | selection | object- Click to replace the selection; an exact repeat clears it. Shift/Meta/Ctrl-click toggles membership (whole series for Line, Area): true uses its data's selection, or give a selection(). input("root").set("id") writes an input instead: a click sets it to the clicked row's id (a drill-down's root), .set(literal(v)) to a constant, .reset() to its default, and a click on nothing restores its default (input("root", {default}), else a Select of that name's, else null); several marks may write one input.
hoverboolean | selection | object- Mark the row under the pointer as @hovered (a whole series for Line, Area), without fading the others: true uses its data's hover, or give a selection(). input("focus").set("series") writes an input instead: while the pointer is on a row the input shows its series (or .set(literal(v)), a constant), then its committed value again (a hover that would change this mark's own rows is an error).
tooltipboolean | field[] | object- Show the nearest row's values in a box by the pointer: true, a list of fields, or {fields, radius, content}. Default: the Plot's.
nearestboolean | selection | object- Mark the row a tooltip shows as @nearest, with or without the tooltip: under the pointer, else the nearest drawn row within radius pixels (a whole series for Line, Area): true, a selection(), or {selection, radius}. Default: the Plot's.
respondboolean | "selected" | "brushed" | "hovered" | "nearby" | "nearest" | selection | array- Which interaction states fade this mark's other rows to selectionOpacity; "hovered" fades them while hovering, "nearest" while a row is nearest. Default: the states it sets, except hover and nearest.
selectionOpacitynumber- The opacity of the rows outside the selection while one is active. Default:
0.25. onclick(event) => void- Called for click on this mark; row provenance is optional after transforms.
ondblclick(event) => void- Called for dblclick on this mark; row provenance is optional after transforms.
oncontextmenu(event) => void- Called for contextmenu on this mark; row provenance is optional after transforms.
onpointerenter(event) => void- Called for pointerenter on this mark; row provenance is optional after transforms.
onpointerleave(event) => void- Called for pointerleave on this mark; row provenance is optional after transforms.
onpointermove(event) => void- Called for pointermove on this mark; row provenance is optional after transforms.
onpointerdown(event) => void- Called for pointerdown on this mark; row provenance is optional after transforms.
onpointerup(event) => void- Called for pointerup on this mark; row provenance is optional after transforms.
onpointercancel(event) => void- Called for pointercancel on this mark; row provenance is optional after transforms.
onpointerover(event) => void- Called for pointerover on this mark; row provenance is optional after transforms.
onpointerout(event) => void- Called for pointerout on this mark; row provenance is optional after transforms.
onpointermissed(event) => void- Called for pointermissed on this mark; row provenance is optional after transforms.
enterEffectboolean | "fade" | object- How rows that arrive in a keyed update appear: "fade", or {effect, duration, easing}. animate()'s enter option is the value a channel starts from.
exitEffectboolean | "fade" | object- How rows that leave in a keyed update disappear, as enterEffect. animate()'s exit option is the value a channel ends at.
Animation
animationboolean- Animate changes to the mark's values. Default:
false. animationDurationnumber- How long an animated change takes. Default:
300ms. animationEasing"linear" | "quad-in" | "quad-out" | "quad-in-out" | "cubic-in" | "cubic-out" | "cubic-in-out" | "sine-in-out"- The animation's easing. Default:
"cubic-in-out".
Legend settings
legendFontSizenumbersetting- The size of the mark's legend text. Default: the theme's (14 in the default theme). In px.
legendFontFamilystringsetting- The font of the mark's legend text, a CSS font-family. Default: the plot's font.
legendTextColorcolorsetting- The color of the mark's legend text. Default:
"#40505d". legendTickFormatstringsetting- How a colorbar labels numbers: a d3-format string, or a %-pattern for dates. Default:
".3~g".
Color settings
quantizebooleansetting- Step a numeric fill or color into `levels` colors instead of a smooth gradient. Default:
false. levelsnumbersetting- How many colors quantize steps through. Default:
10.
Limits
maxElementsnumbersetting- The most rows the mark prepares on the GPU. Default:
250000.
The mark's own axes
xTransform"linear" | "log" | "sqrt" | "symlog"setting- This mark's own x transform, instead of its frame's. Default: its frame's.
xInvertbooleansetting- Reverse this mark's x direction. Default:
false. xbounds[number, number]setting- The x extent this mark maps, instead of its frame's domain (an image's or a grid's extent). Default: its frame's.
xrange[number, number]setting- Where this mark's x extent lands, in its frame's world units. Default: its frame's.
yTransform"linear" | "log" | "sqrt" | "symlog"setting- This mark's own y transform, instead of its frame's. Default: its frame's.
yInvertbooleansetting- Reverse this mark's y direction. Default:
false. ybounds[number, number]setting- The y extent this mark maps, instead of its frame's domain (an image's or a grid's extent). Default: its frame's.
yrange[number, number]setting- Where this mark's y extent lands, in its frame's world units. Default: its frame's.
zTransform"linear" | "log" | "sqrt" | "symlog"setting- This mark's own z transform, instead of its frame's. Default: its frame's.
zInvertbooleansetting- Reverse this mark's z direction. Default:
false. zbounds[number, number]setting- The z extent this mark maps, instead of its frame's domain (an image's or a grid's extent). Default: its frame's.
zrange[number, number]setting- Where this mark's z extent lands, in its frame's world units. Default: its frame's.
Shading
transparentbooleansetting- Draw the mark in the transparent pass, blended in depth order with other transparent marks. Default:
false.
Advanced renderer options
maxInstancesnumber | null- The most rows drawn; past it the rows are sampled (null draws them all), though SVG and PDF exports draw every row. Default:
null.
Usage
Use BandX(x0=2, x1=4, fill="#3478c7") in Python, or <BandX x0={2} x1={4} fill="#3478c7" /> from hmplot/charts. Bounds are data coordinates (numbers, dates or column names). Constant bounds draw one band; columns draw one per row. The other dimension follows the frame’s visible domain as it pans and zooms. Bands do not widen automatic domains and have no legend entry unless legend=True is set. Use fill, opacity and Rect’s outline styling; compose Text or Callout for an annotation (label is the legend/settings label). Place a band before foreground marks. This is Plotly’s add_vrect pattern; RuleX(x=...) and RuleY(y=...) cover add_vline and add_hline. For a rectangle bounded in both dimensions, use Rect. These are frame-coordinate bands, not screen overlays; in non-Cartesian frames they follow Rect’s coordinate mapping.
BandX is a chart: a template over public components, defined in one file, src/lib/charts/bandX.js.