GraphData
A graph from edges, with nodes given or inferred from the edges' endpoints; ordinary transforms operate on the selected table.
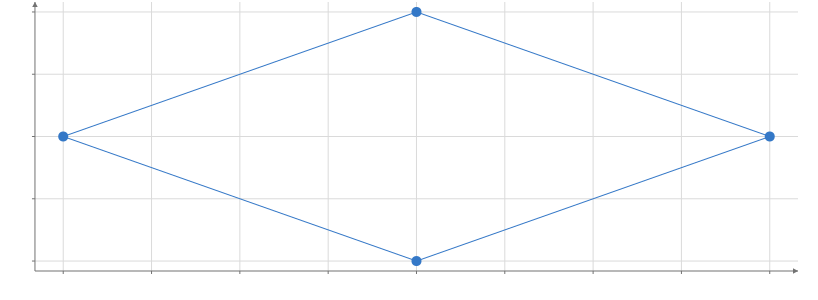
Static preview; loading the interactive plot
<script>
  import {
    Plot,
    GraphData,
    Edges,
    Nodes,
    Segments,
    Points,
    Calculate,
    multiply,
  } from "hmplot";
  const edges = { source: ["A", "A", "B", "C"], target: ["B", "C", "D", "D"] };
  const nodes = {
    id: ["A", "B", "C", "D"],
    column: [0, 1, 1, 2],
    lane: [1, 0, 2, 1],
  };
</script>

<GraphData {nodes} {edges}>
  <Nodes>
    <Calculate columns={{ x: multiply("column", 2), y: "lane" }}>
      <Plot height={300}>
        <Edges><Segments start="start" end="end" /></Edges>
        <Nodes><Points position="position" /></Nodes>
      </Plot>
    </Calculate>
  </Nodes>
</GraphData>
Usage
GraphData builds the graph that layouts (Tree, DAG, Force, Pack, Treemap, Sankey) and the Nodes and Edges scopes read. It takes its tables in one of three ways:
nodesandedges: an explicit node table and an edge table.nodeKeynames the unique node ID column.edgesalone: the nodes are inferred from the edges’ endpoints, one per distinct ID, in the order the IDs first appear (each edge’s source, then its target). Their ID column isid.- Neither: the surrounding data (a Plot’s
data, a Data or a transform above) are the edges, and the nodes are inferred as above. Rows hidden above (a Filter) contribute no nodes.
source and target name the edge endpoint columns (default source and target). The default scope is the edges. Use Nodes or Edges to select a relation, then apply ordinary table transforms and marks. Isolated nodes (explicit node tables only), cycles, self-loops and parallel edges are supported; individual layouts may impose stricter requirements.
reduce adds node columns aggregated from the edge rows: it maps each output name to a reducer, {op, field} (op one of count, sum, mean, min, max, first, last, variance, std, any, all). nodeFrom="source" (the default) groups edge rows by source ID; "target" groups by target ID. A reduced column replaces a same-named node attribute; nodes without matching rows receive the reducer’s empty value. Changes to numerical attributes reuse the endpoint grouping plan; endpoint identity changes rebuild it.
The graph relationship is a capability of the data, like a grid descriptor. Marks and ordinary transforms see a table. Filtering nodes induces the remaining edges; changes in one branch do not affect sibling branches. Transforms that discard identity produce ordinary tables and cannot subsequently feed a graph layout.
An existing table retains its own observation key and interaction resources. nodeKey maps graph endpoints independently; it does not rekey a shared table. In Python, marks and containers under Nodes expose the supplied node Table’s selection, brush and hover resources, while Edges and the default graph scope expose the edge Table’s (or, without edges, the surrounding data’s). Inferred nodes are computed in the browser and have no Python host Table: pass nodes when Python needs their selection. Browser interactions still work on them.
GraphData does not position nodes. Provide a two- or three-dimensional position column, or x/y and optional z. Calculate can create these inside Nodes. Edge start/end columns gather current node coordinates lazily when consumed, including after node transforms. Layouts accept this graph directly and publish their own geometry.
Migration
FromEdges is part of GraphData: replace FromEdges with GraphData, keeping its source, target, nodeFrom and reduce. A FromEdges under a GraphData that enriched its nodes becomes that GraphData’s reduce and nodeFrom.
Replace the old Graph with GraphData and ordinary node coordinate columns. Move nodes, nodeKey, source and target from Force, Tree, DAG, Pack, Treemap or Sankey to GraphData.