LayoutGrid
Lays its children out in rows of equal columns (Python hm.Grid).
Python only. Svelte pages lay this out with HTML and CSS.
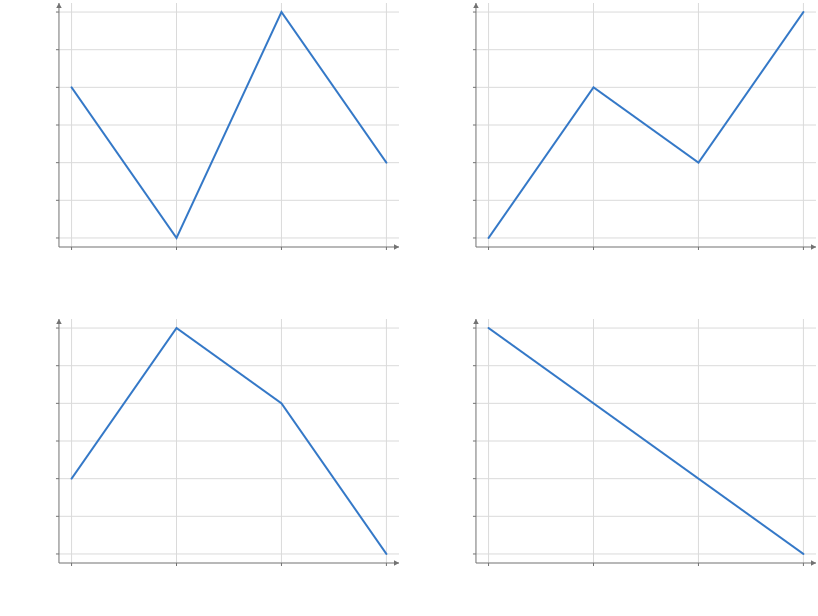
Static preview; loading the interactive plot
import hmplot as hm

data = {"x": [1, 2, 3, 4], "a": [3, 1, 4, 2], "b": [1, 3, 2, 4], "c": [2, 4, 3, 1], "d": [4, 3, 2, 1]}
with hm.Grid(columns=2) as grid:
    for name in ["a", "b", "c", "d"]:
        with hm.Plot(data=data, height=300, axes2d=True):
            hm.Line(x="x", y=name)
grid
Usage
Python’s hm.Grid(columns=2) is a layout grid, beside Row and Column; the scene adapter names that node LayoutGrid. Interpolation is Interpolate. Svelte uses CSS grid.