DAG
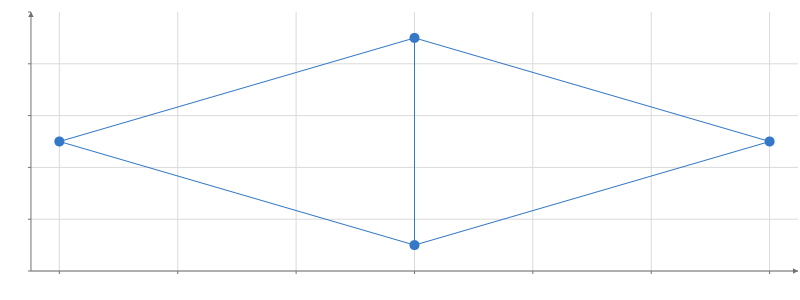
A layered layout of a directed acyclic graph, with edges routed around the nodes.
Static preview; loading the interactive plot
<script>
  import { Plot, DAG, Edges, Nodes, Routes, Points, GraphData } from "hmplot";
  const data = {
    source: ["a", "a", "b", "c", "a"],
    target: ["b", "c", "d", "d", "d"],
  };
</script>

<Plot {data} height={300}>
  <GraphData source="source" target="target"
    ><DAG>
      <Edges><Routes /></Edges>
      <Nodes><Points position="position" /></Nodes>
    </DAG></GraphData
  >
</Plot>
Usage
DAG consumes GraphData and uses d3-dag’s Sugiyama layout to place an acyclic directed graph. It exposes node positions and bounds, edge endpoints, and complete routed paths. Routes draws the paths; ordinary edge marks can use start and end. The layout runs when input changes.